

Despite the Pullback, US Large Cap Tech Looks Bullish
Here are this week's Relative Strength Rank and Trend Reports

Relative Strength Rank and Trend Reports
User Guide to Relative Strength Rank & Trend Reports - Click Here
Click to enlarge all stacks
Here is a link to a recent blog post describing how to make watchlists for individual components within Indexes, Sectors, & Sub-Sectors based on their relative strength rank trend and money flow score. It’s one of the best ways to discover parts of the market catching fire but before they break out.
Risk Disclosure
Global Assets
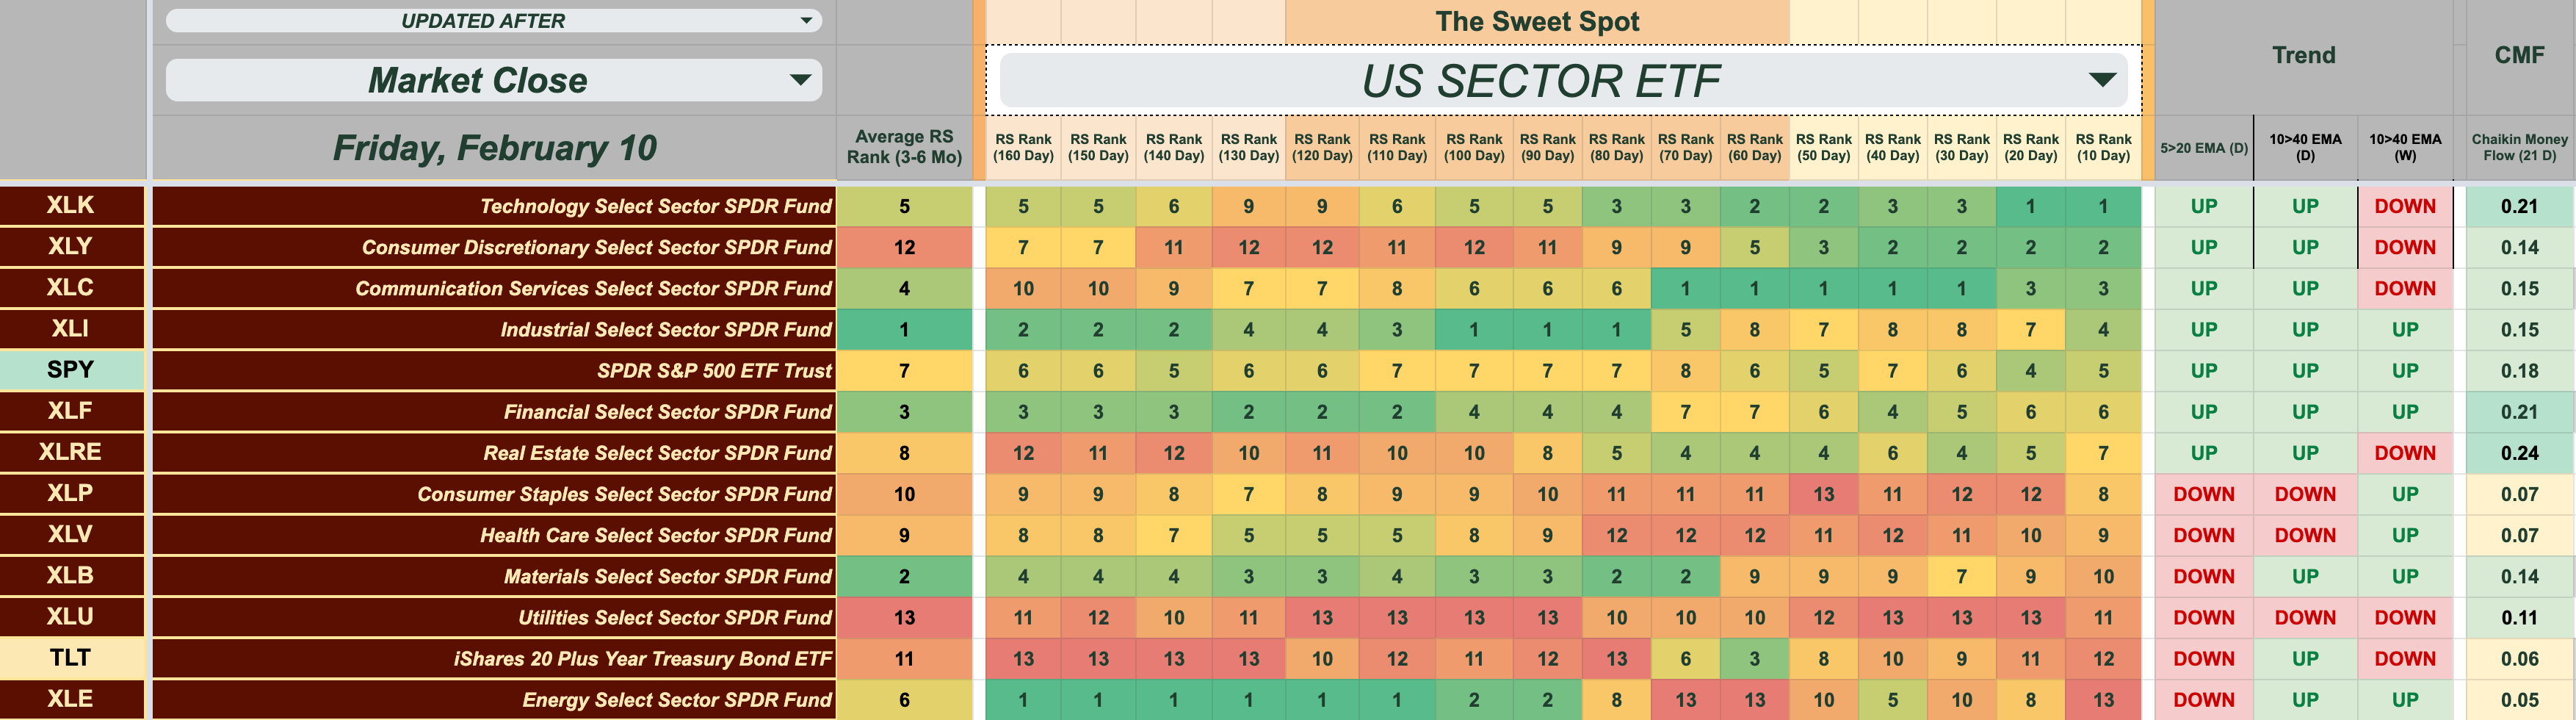
Despite the recent pullback and large-cap layoff announcements just about daily, QQQ’s relative strength rank rotation now penetrates the Sweet Spot, moving from 14th to 1st over the past 90 days, supported by a very bullish Chaikin Money Flow score of above .2. US tech (in the US sector stack) is also leading the relative strength rankers out of 11 economic sectors. US mid-caps, small-caps, and now micro-caps (IWC) are also showing superior relative strength rank improvement through that critical 3 - 6 calendar month window. The relative strength of these more economically sensitive stock ETFs reinforces the idea that the stock market retracement of the past week is more of a consolidation of gains than an early sign of a bearish market reversal. Time will tell. The dollar, UUP, made a move this week, propelling it from 24th to 3rd over the past 30 day look-back period. A rising dollar would be bearish for multi-national stocks, but so far the move has been made across what’s hardly a worrisome time-frame .
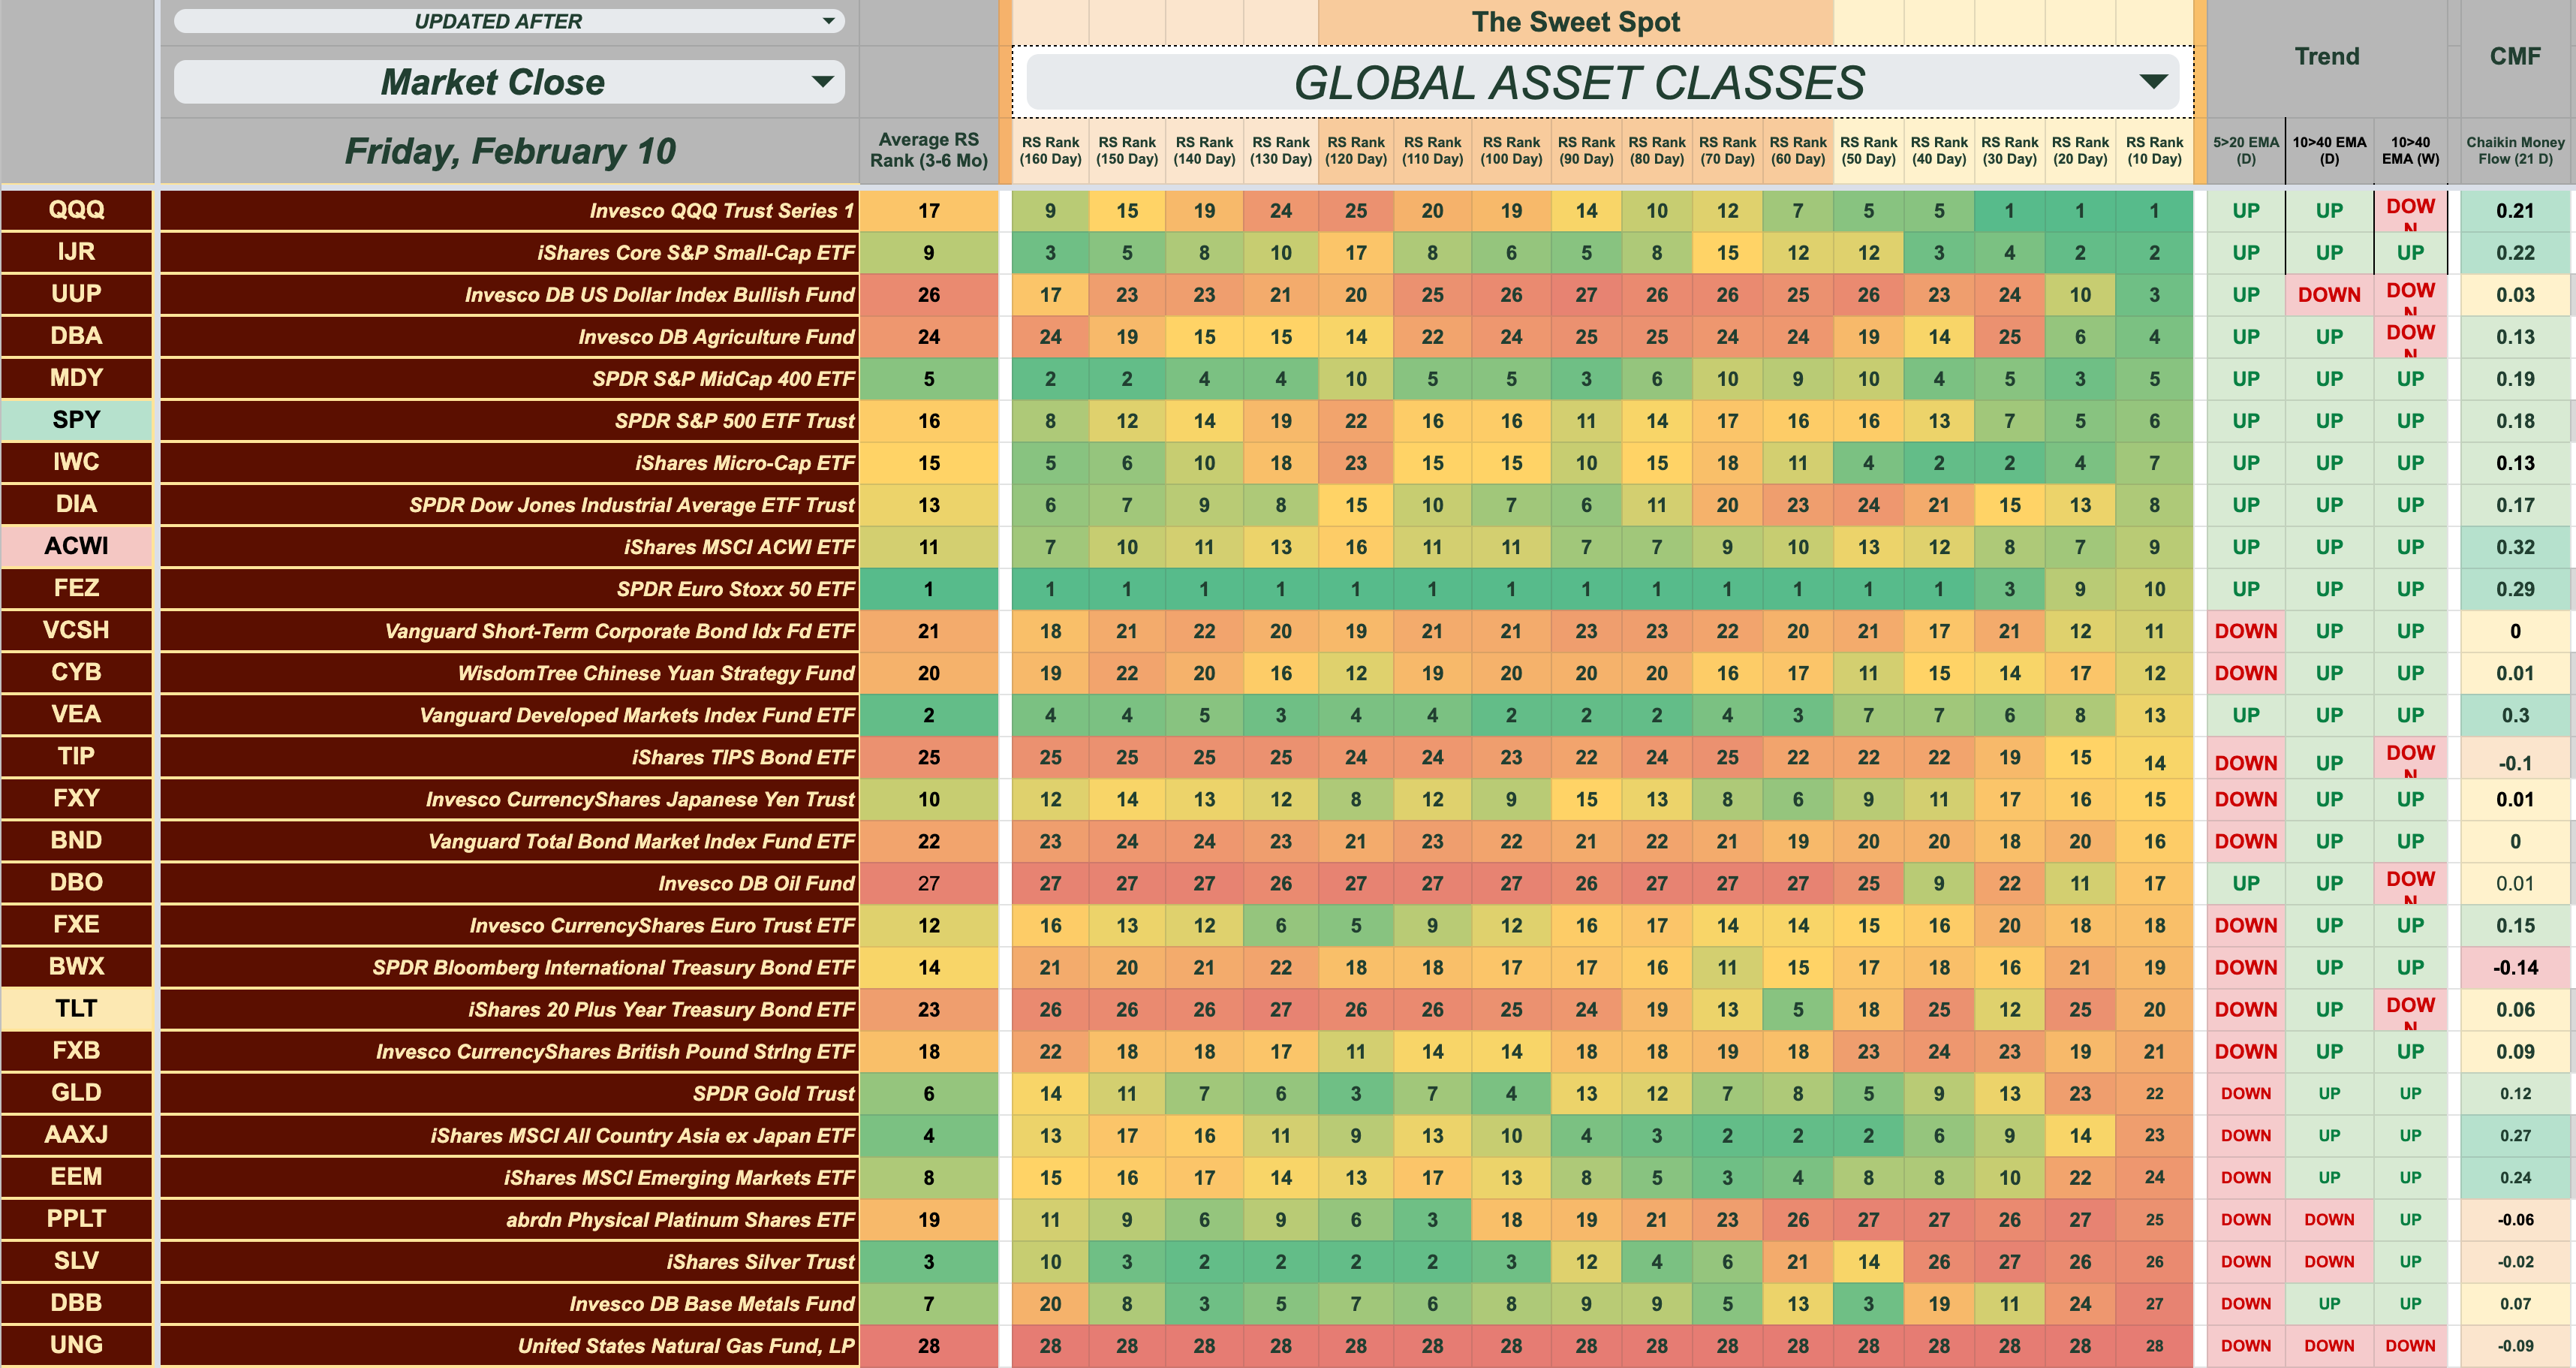
Platinum, silver, gold and precious/industrial metals are all exhibiting bearish rotation. Oil and natural gas also appear to have nothing going on. Bearish relative strength rank may be highlighting the impact of rate hikes on global demand, which runs counter to the bullish equity narrative. Tomorrow, we’ll take a look at the market forecast indicator, which may shed some light on whether the stock pullback is set to continue.
Click to Enlarge
Click to Enlarge
Cheat Sheets Premium Stacks
Take advantage of a 7-day trial prior to purchasing a Premium Cheat Sheet Subscription.
