Market Conditions

Market Conditions - Relative Strength Rank and Trend
Mid - January 2023
Stock markets are more bullish than I anticipated after the first two trading weeks of 2023. .
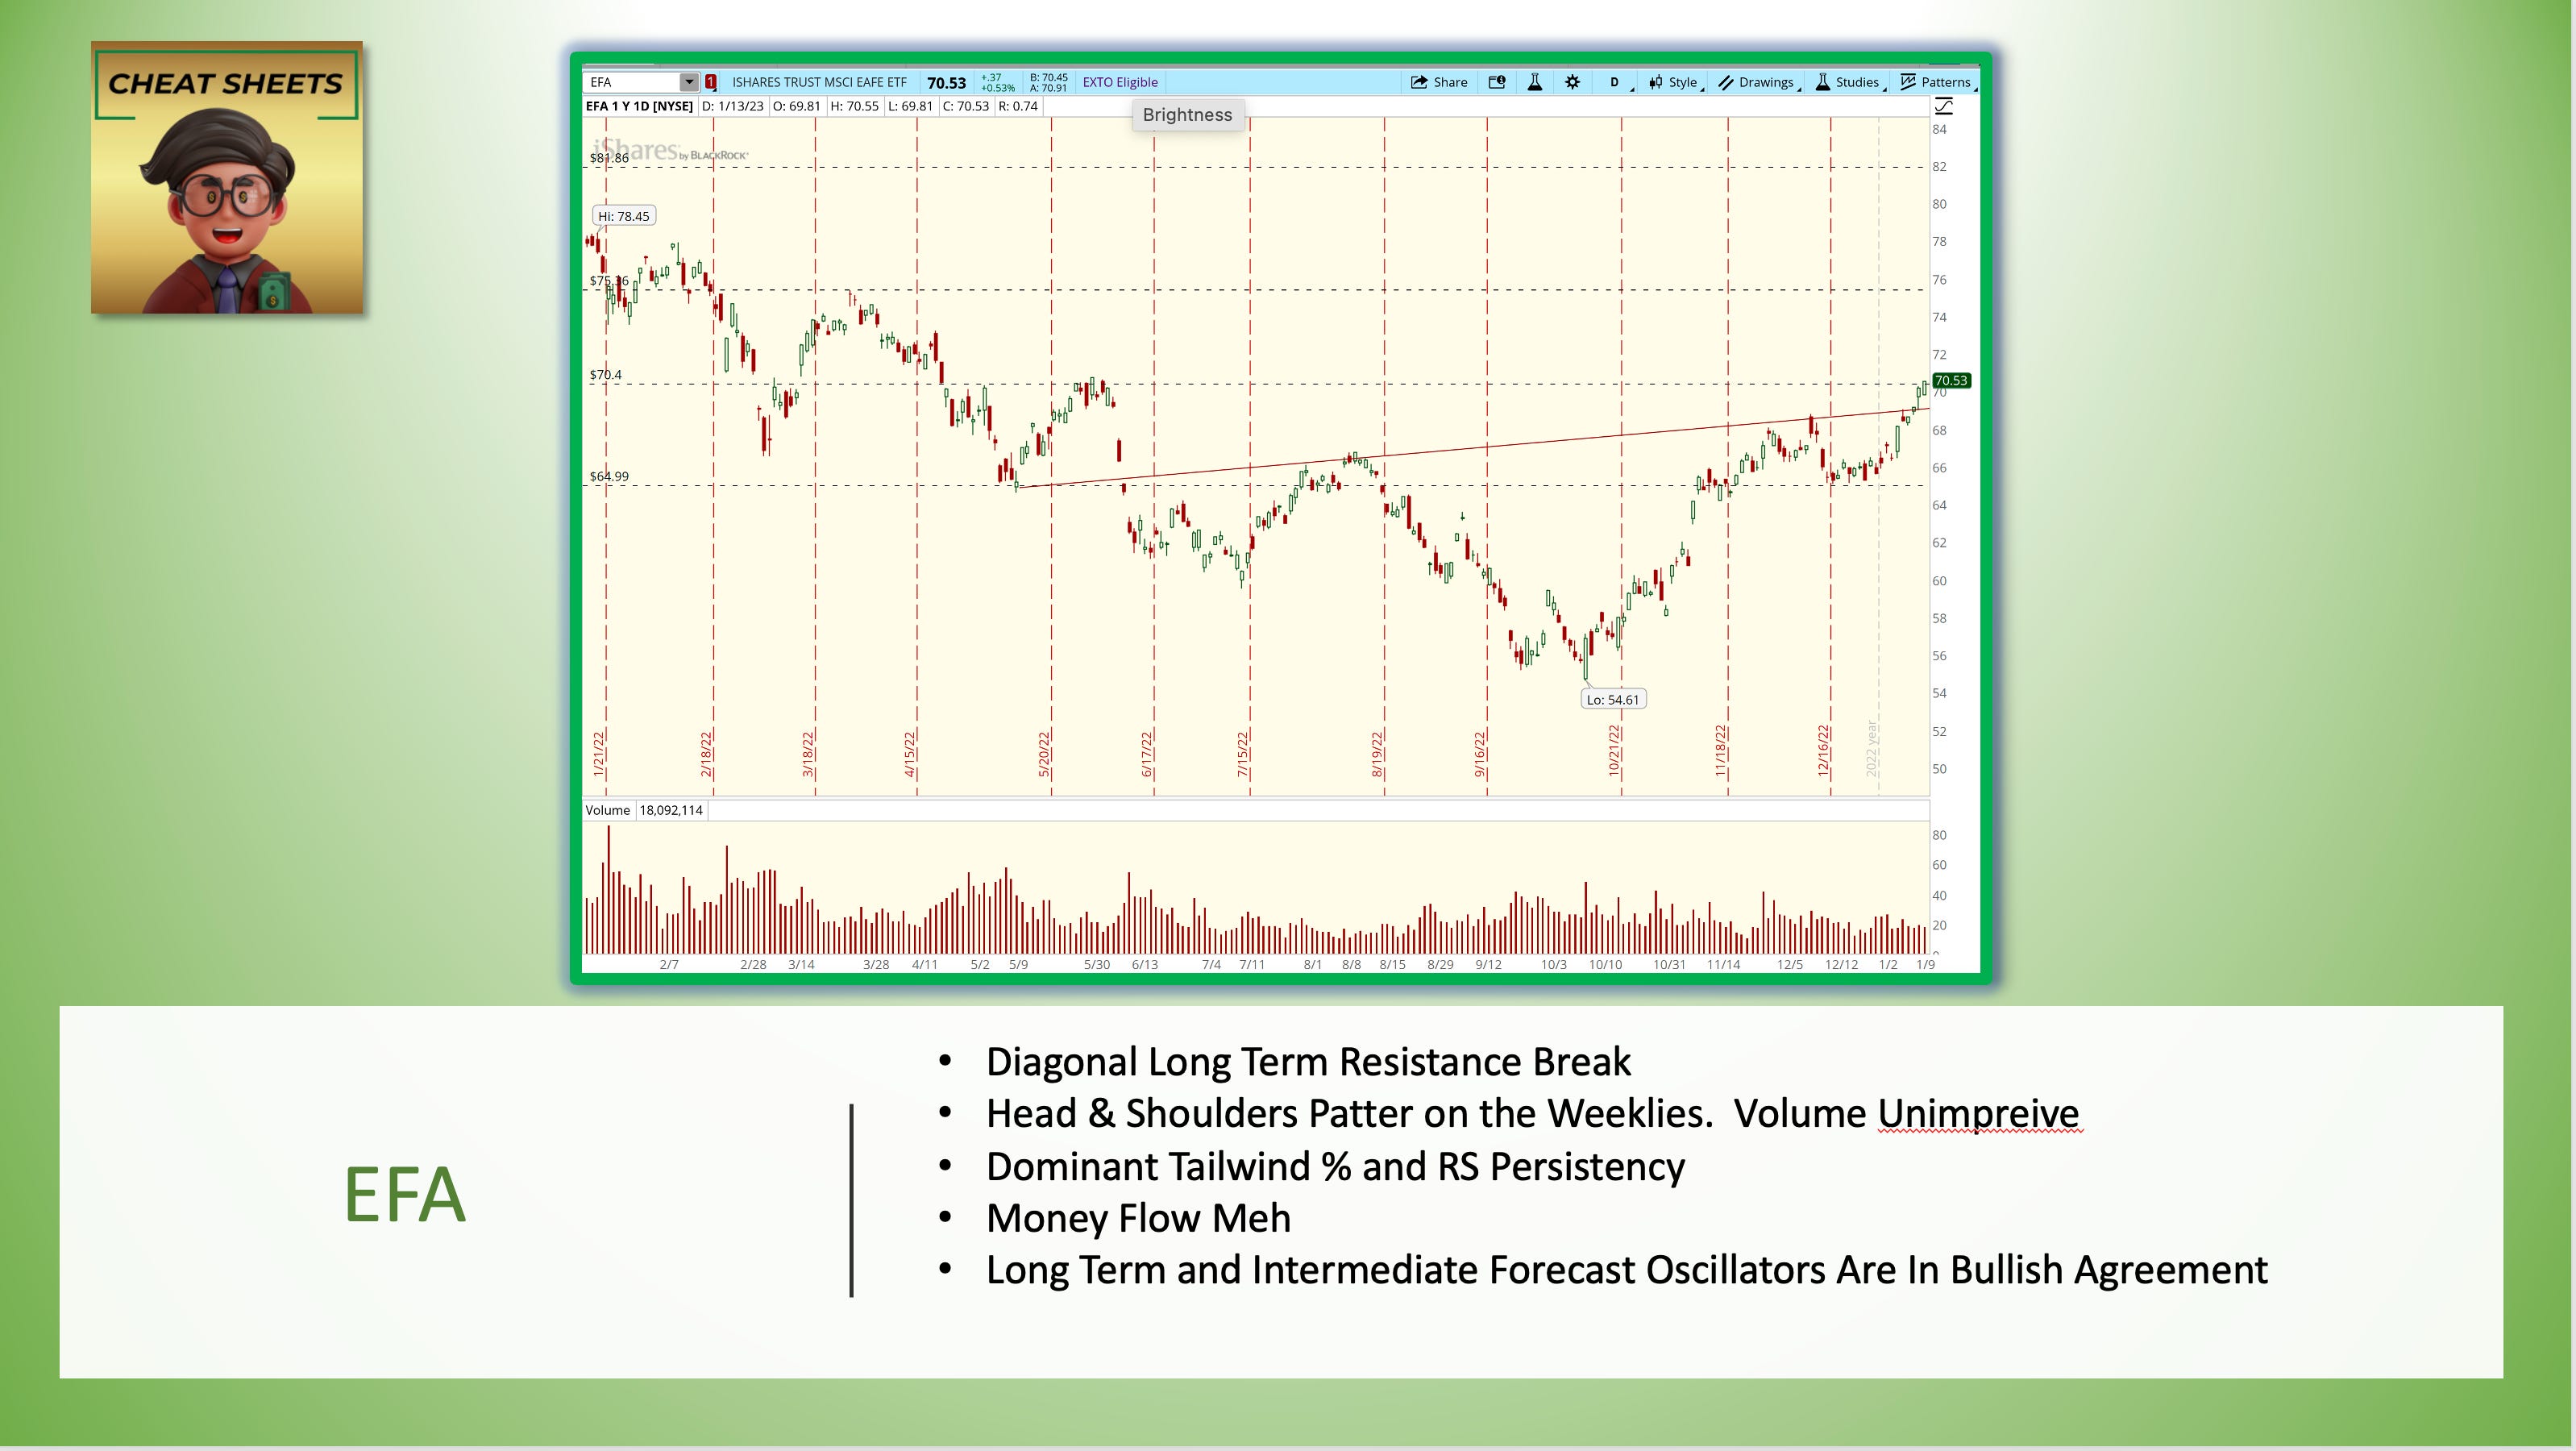
Europe, Far East & Australia ETF (EFA) and Vanguard “Rest of World - EX US ETF (VEU ) are persistent out-performers, though institutional money flow has waned a touch .
EEM’s more recent rotation into favor, accompanied by strong money flow, appears correlated with the fall-off of the US dollar (UUP). These instruments typically ebb and flow with inverse proportionality.
Despite still strong Chaikin Money Flow (Very Bullish .22) US mega-cap DIA relative strength has softened though just barely outside of the “sweet spot. ” Until that ETF’s relative price performance wanes across a longer look back periods and gets into the 60 to 120 trading day zone, I conclude that it’s simply a slowing of price momentum as the instrument moves up to resistance at around $345.
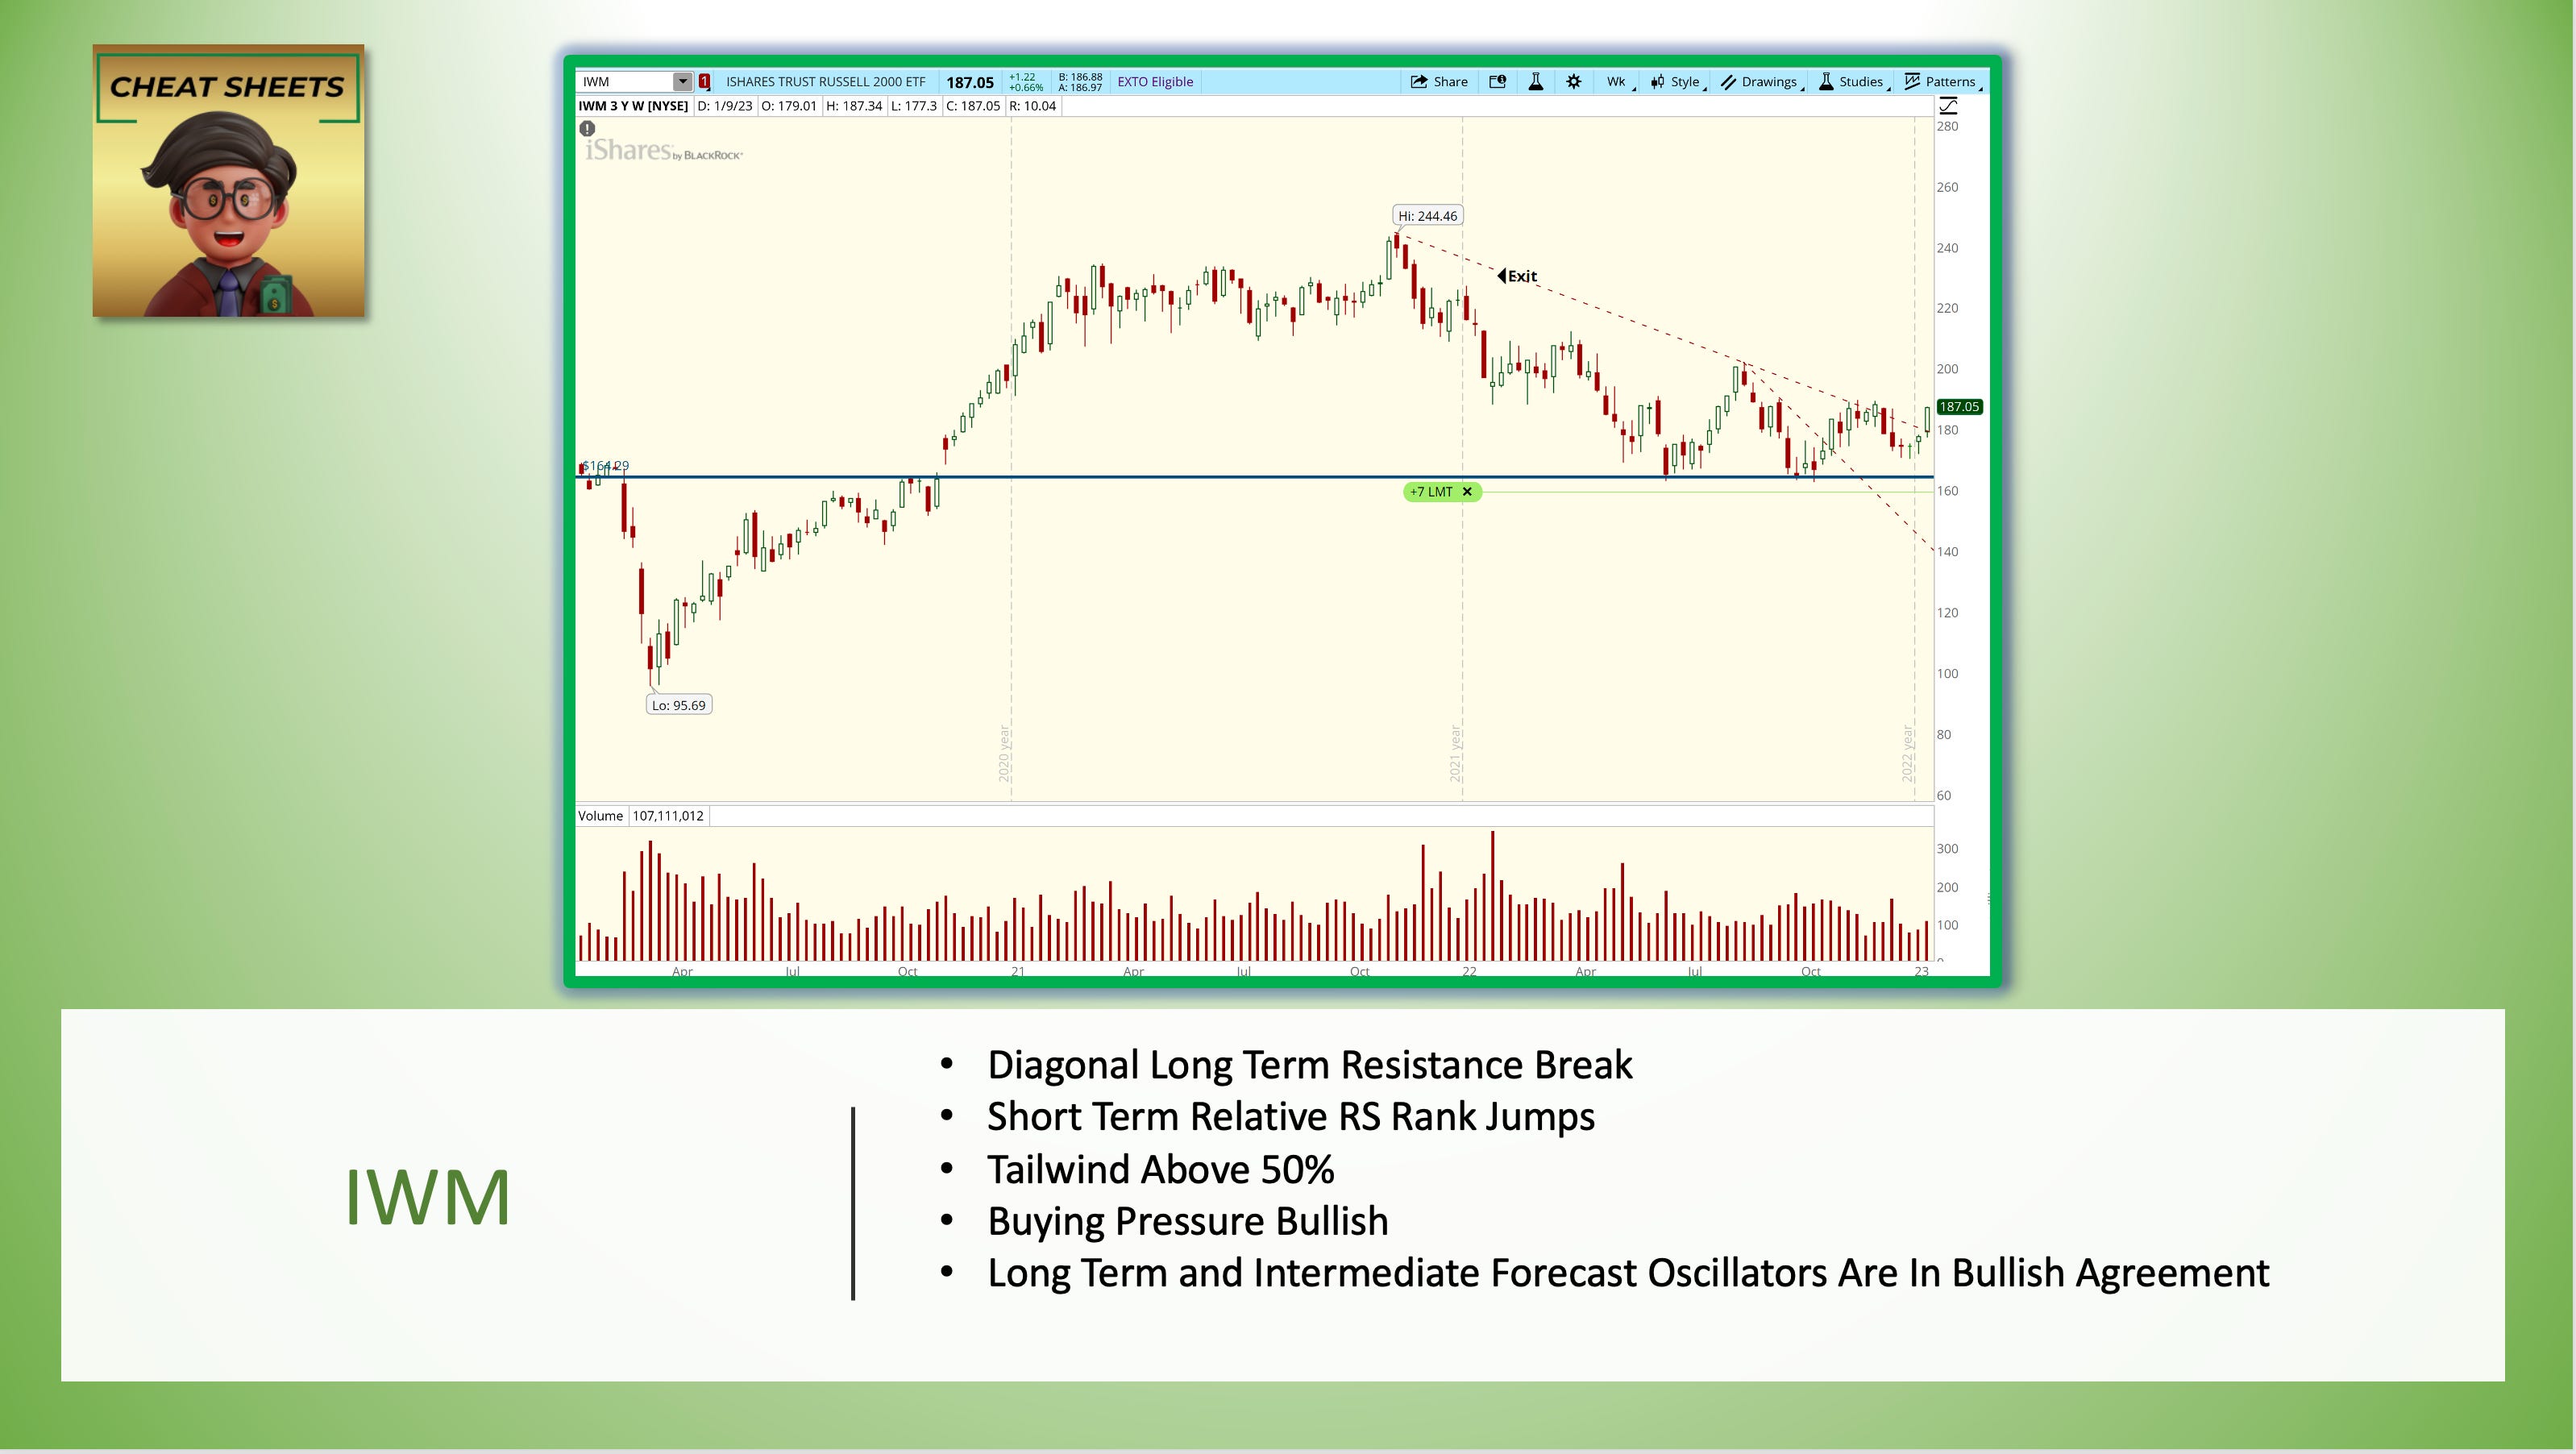
The IWM’s relative strength picture is mixed. But it’s RS ranks have progressed 8th, 6th, 4th & 2nd over the past 10-weeks/50 trading-days while Chaikin Money Flow has risen to a near Very Bullish .18.
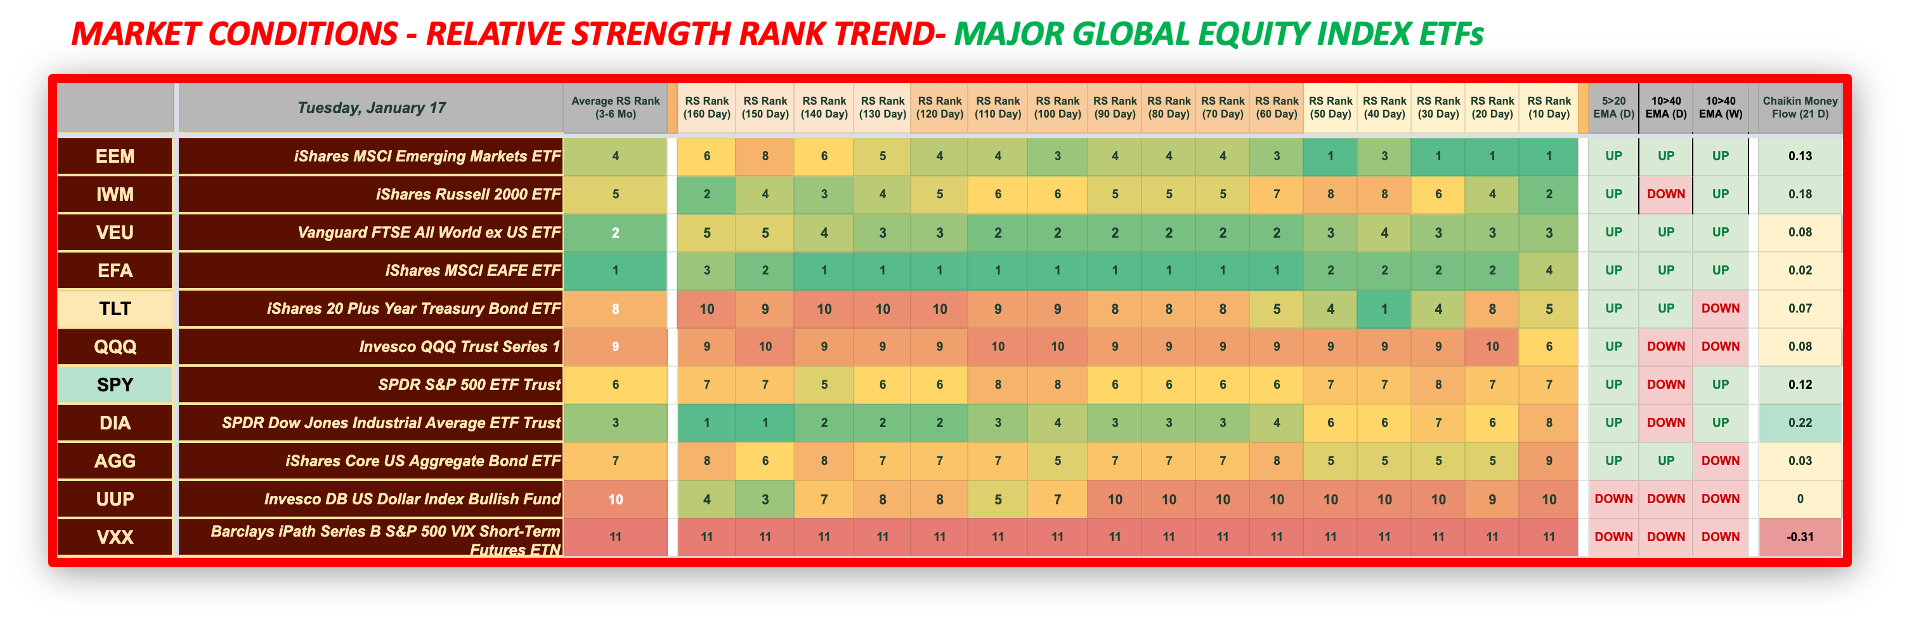
Each stock and bond ETF is stack ranked from first to worst. Because relative price movement often happens before significant price trends emerge, and this gives us a jump on where stocks may be headed. Especially when Money Flow is above .1
The RSR&T report above is a leading indicator, which subjects major stock market index ETFs to a grading curve . It’s the ETF’s report card based on its relative (or competitive) price performance compared to the others in the stack. Notice, there’s no return percentages or price delta’s quoted above. It’s all about how each ETF’s return ranks in a particular look-back period , and how that rank changes over time, that matters most.
For example, in the past 30 trading days, or six calendar weeks, EEM’s price appreciated from 37.72 to $41.30 for a gain of roughly 9.5%. Out of all ETFs in stack above, EEM was best performing. No other ETF went up more. So, it ranks #1 for that look back period, as designated in the column marked RS Rank (30).
If all stocks went down during a look-back period, and EEM had gone down the least among them, it would still command a #1 rank in the RSR&T.
EEM’s rank performance has been better lately. Over the prior 60-days it’s the third best performing. (Keep in mind these are trading days, so 60 days is roughly 12-weeks on the calendar). But, if we look back over a more prolonged time-frame, say 150 days, EEM’s price delta puts it in eighth place among the stocks in the stack. While relative strength rank has improved from 8th to first, according to the chart below, price is basically flat over those 30 trading weeks.
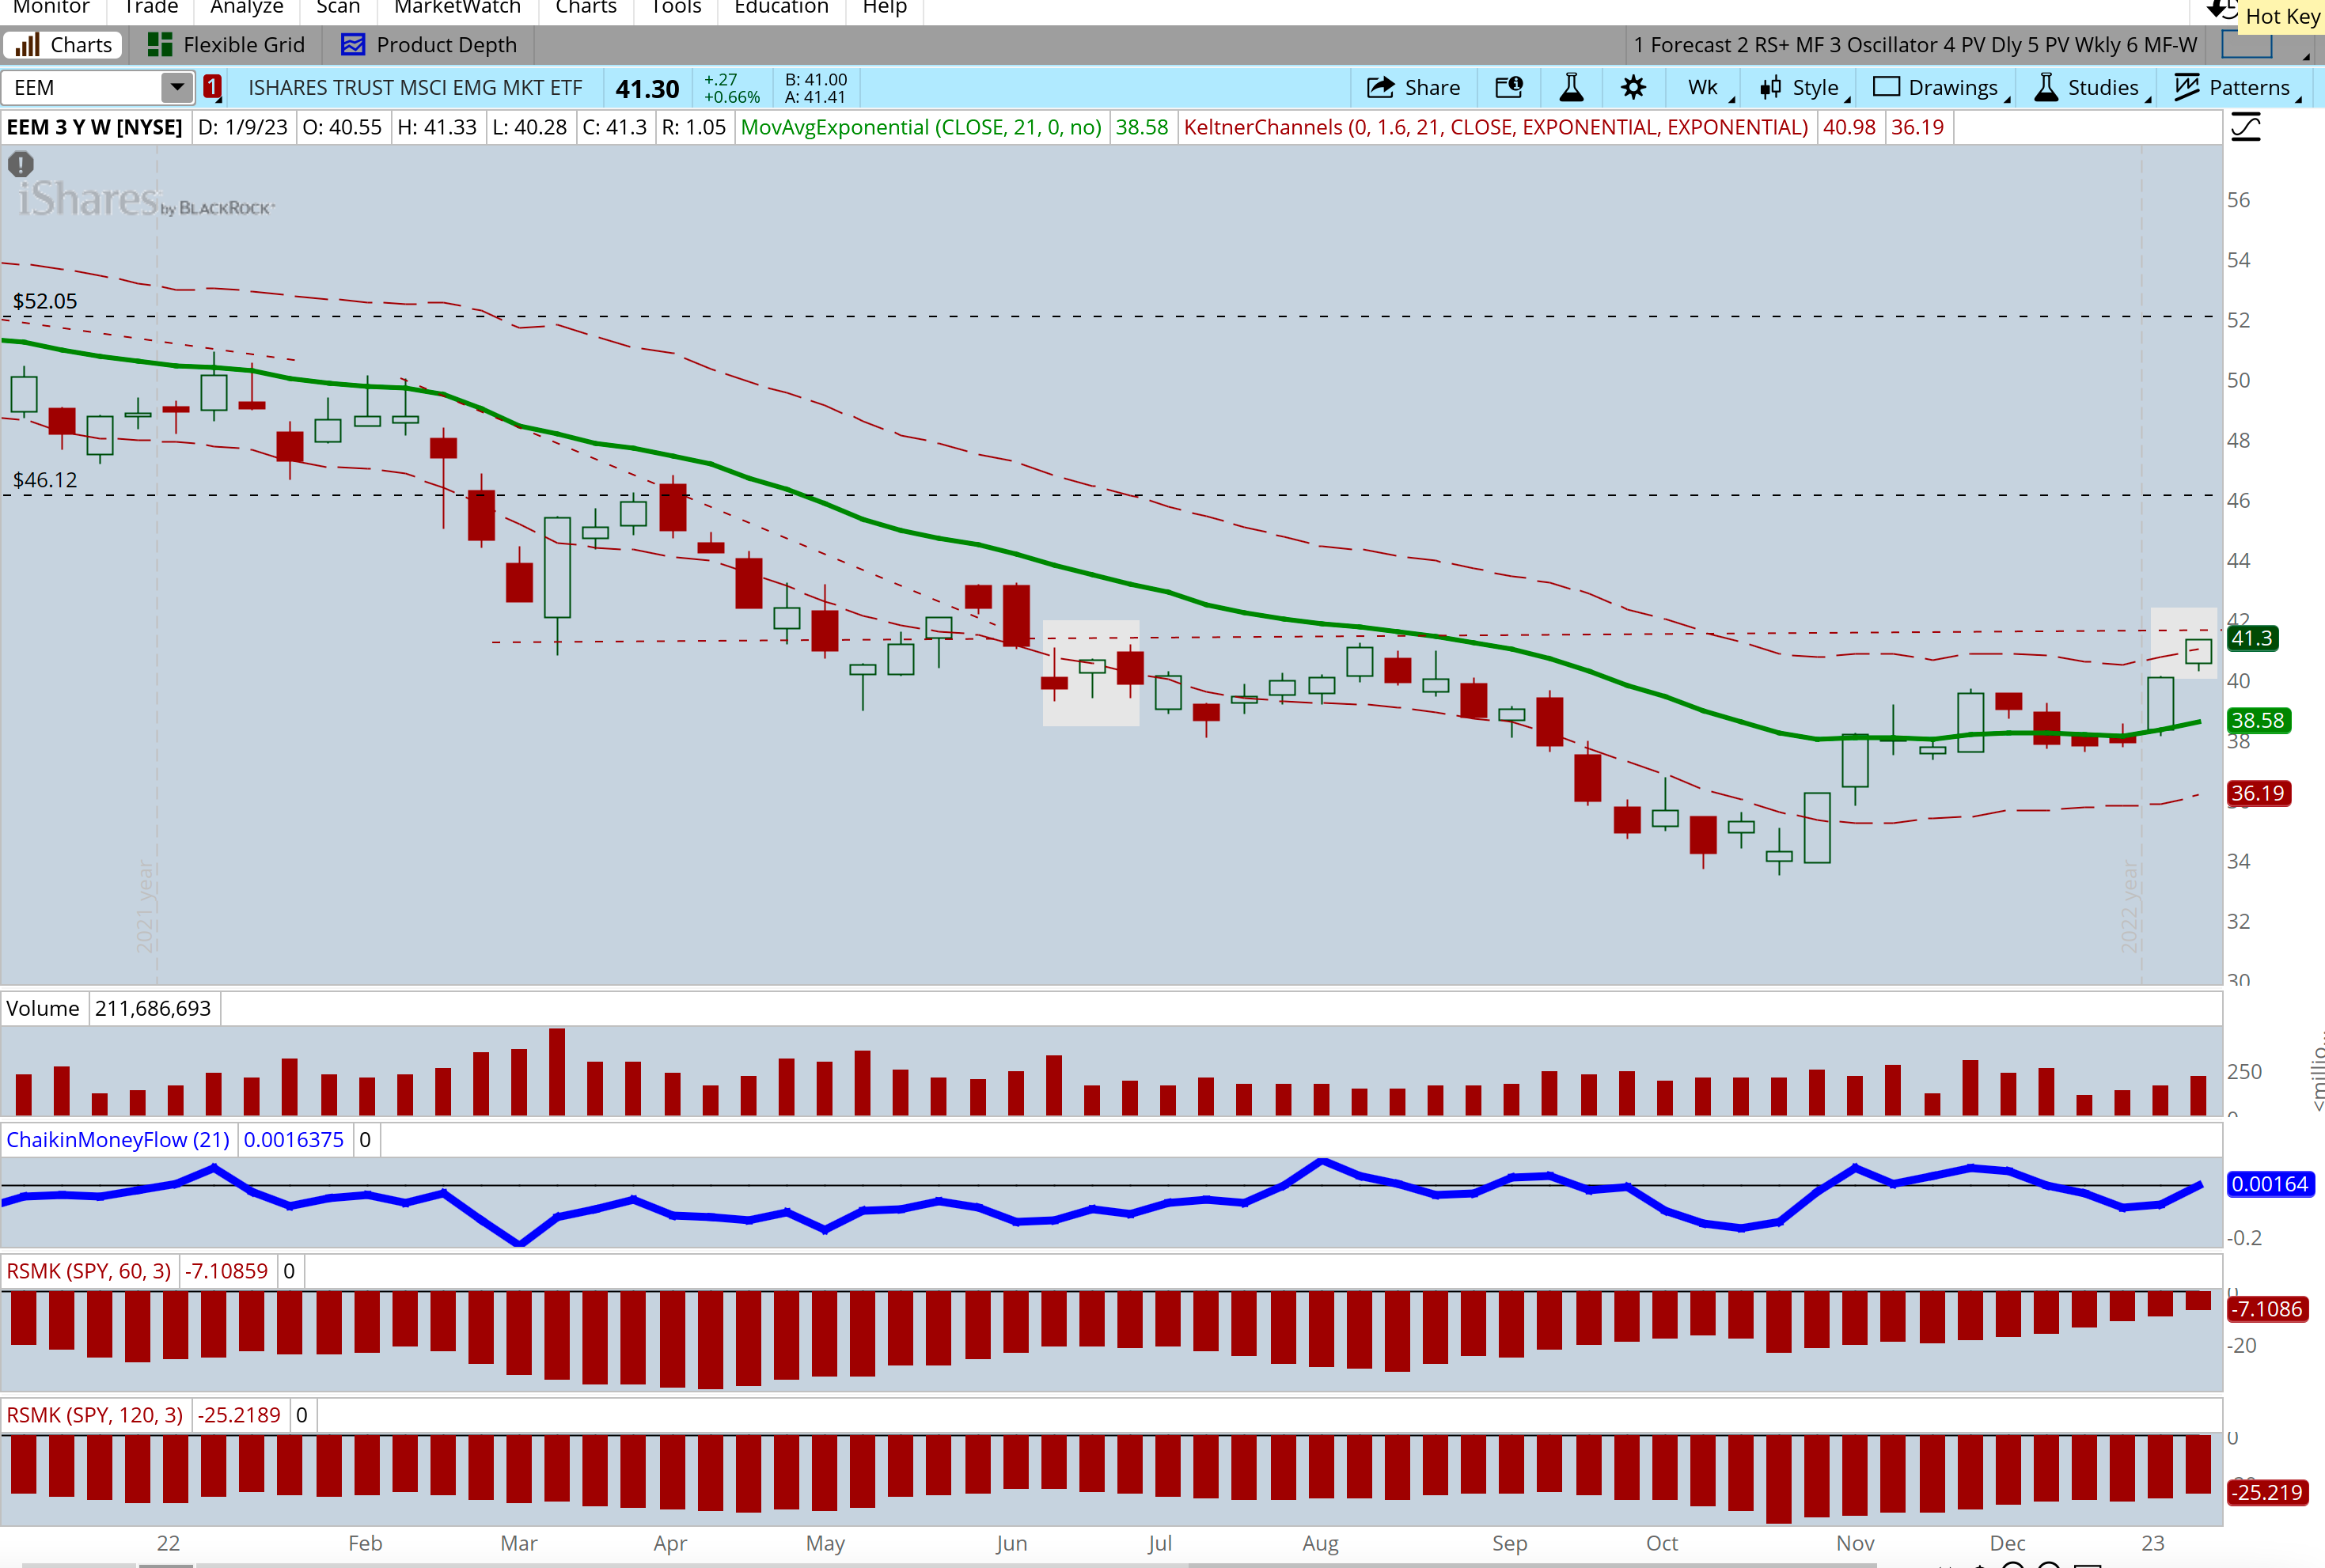
In addition, we know that institutions are accumulating EEM. Money flow is a bullish .13 (above .1 is a level of significant accumulation).
Despite improvements in money flow and EEM’s progression in relative strength rank over the past several months, notice that EEM’s trend started turning up only recently. Price hit bottom in late October. . By December, the green moving average had reversed & started moving higher. Shortly thereafter, price pushed above the moving average, then bounced and moved higher.
We see this all the time, significant relative strength changes, supported by money flow, are often a harbinger of bullish things to come. I can think of no single better way to understand, as hockey great Wayne Gretzky once said, “where the puck is going to be.” While everyone else skates to where the puck is now, traders like Wayne anticipate what’s next.
Our best practice is to make make a watchlist of securities that improve their relative strength position across the 60 to 120 trading day look back period while money flow is above at least .05 (Neutral +), but especially above .10 (Bullish) or .20 (Very Bullish). Then wait for signals, either in the Cheat Sheets stack we provide or in your own trading system.
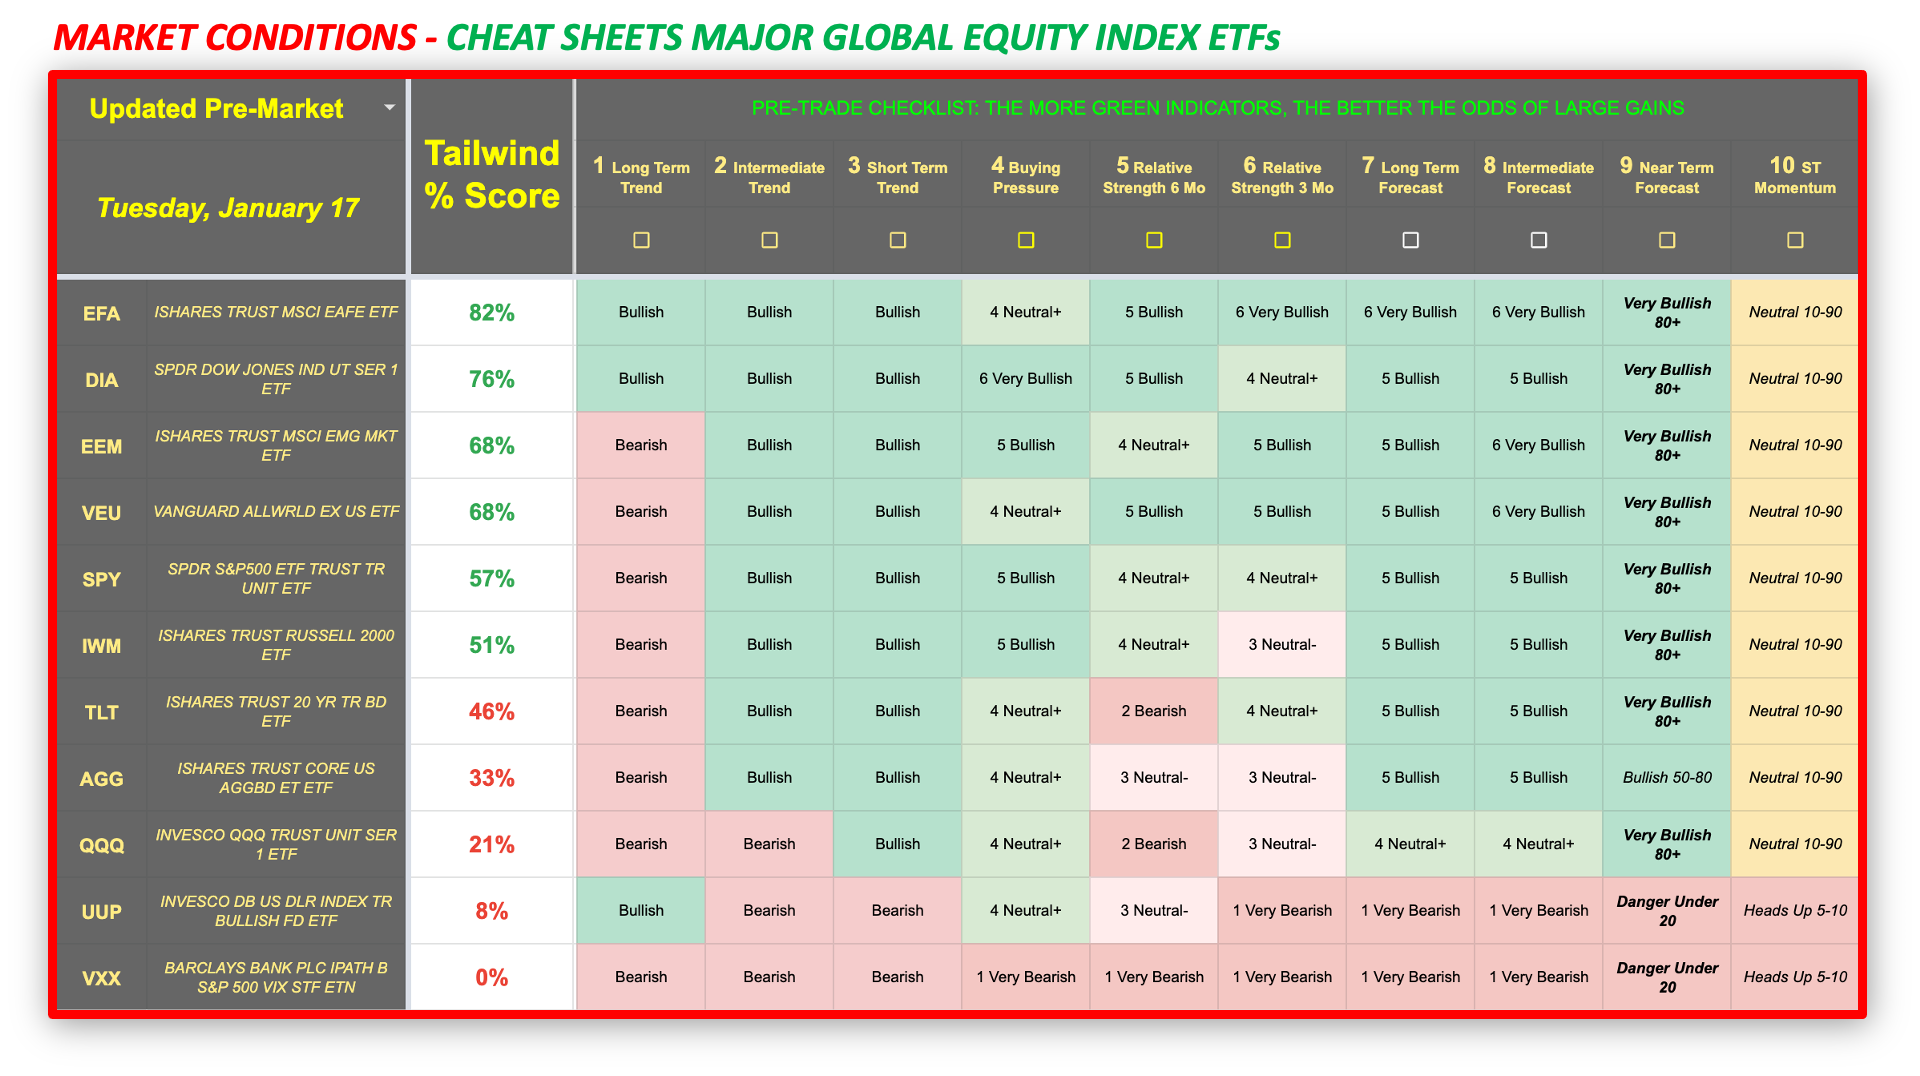
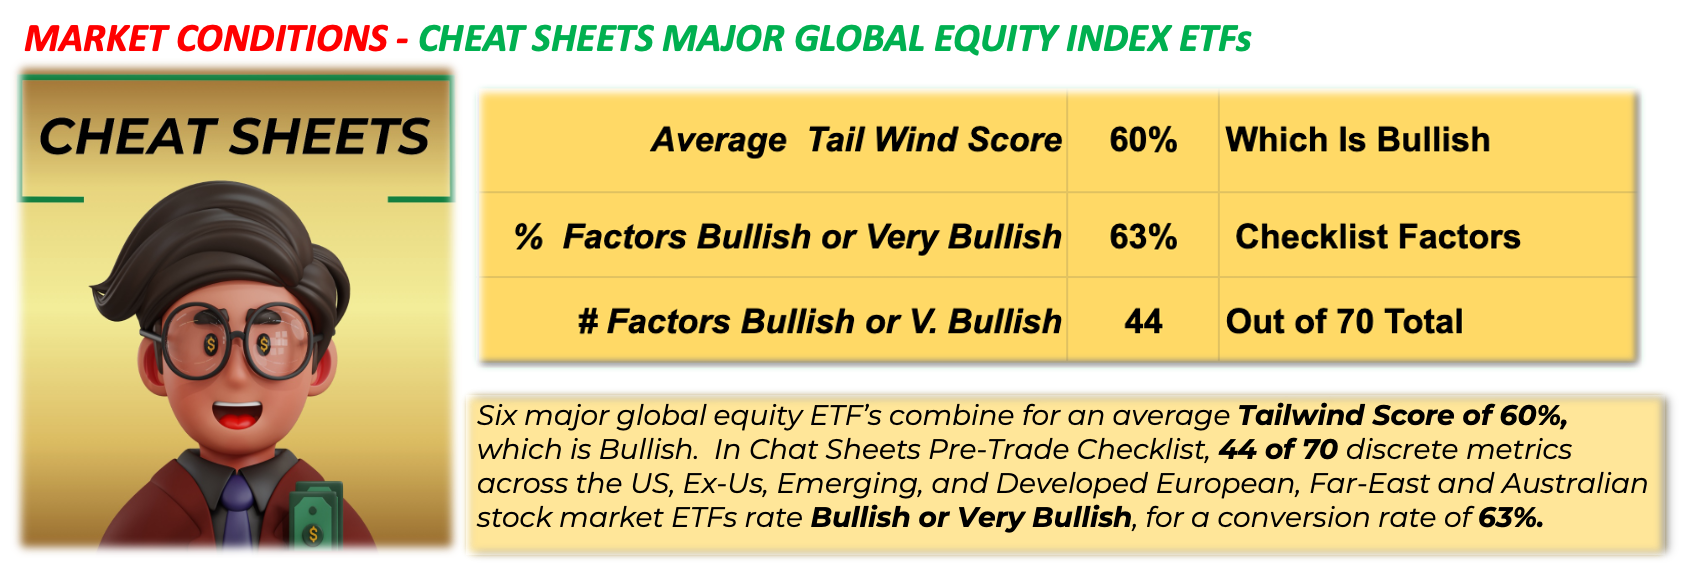
Market Conditions - ETF Factor Ratings and Composite Tailwind % Scores
Indexes to Watch