

Premium Subscriber Stock Worklists for the Trading Week Beginning December 19, 2022
A Bonus Commodity Stack for All Subscribers Included Today as a Holiday Thank You.

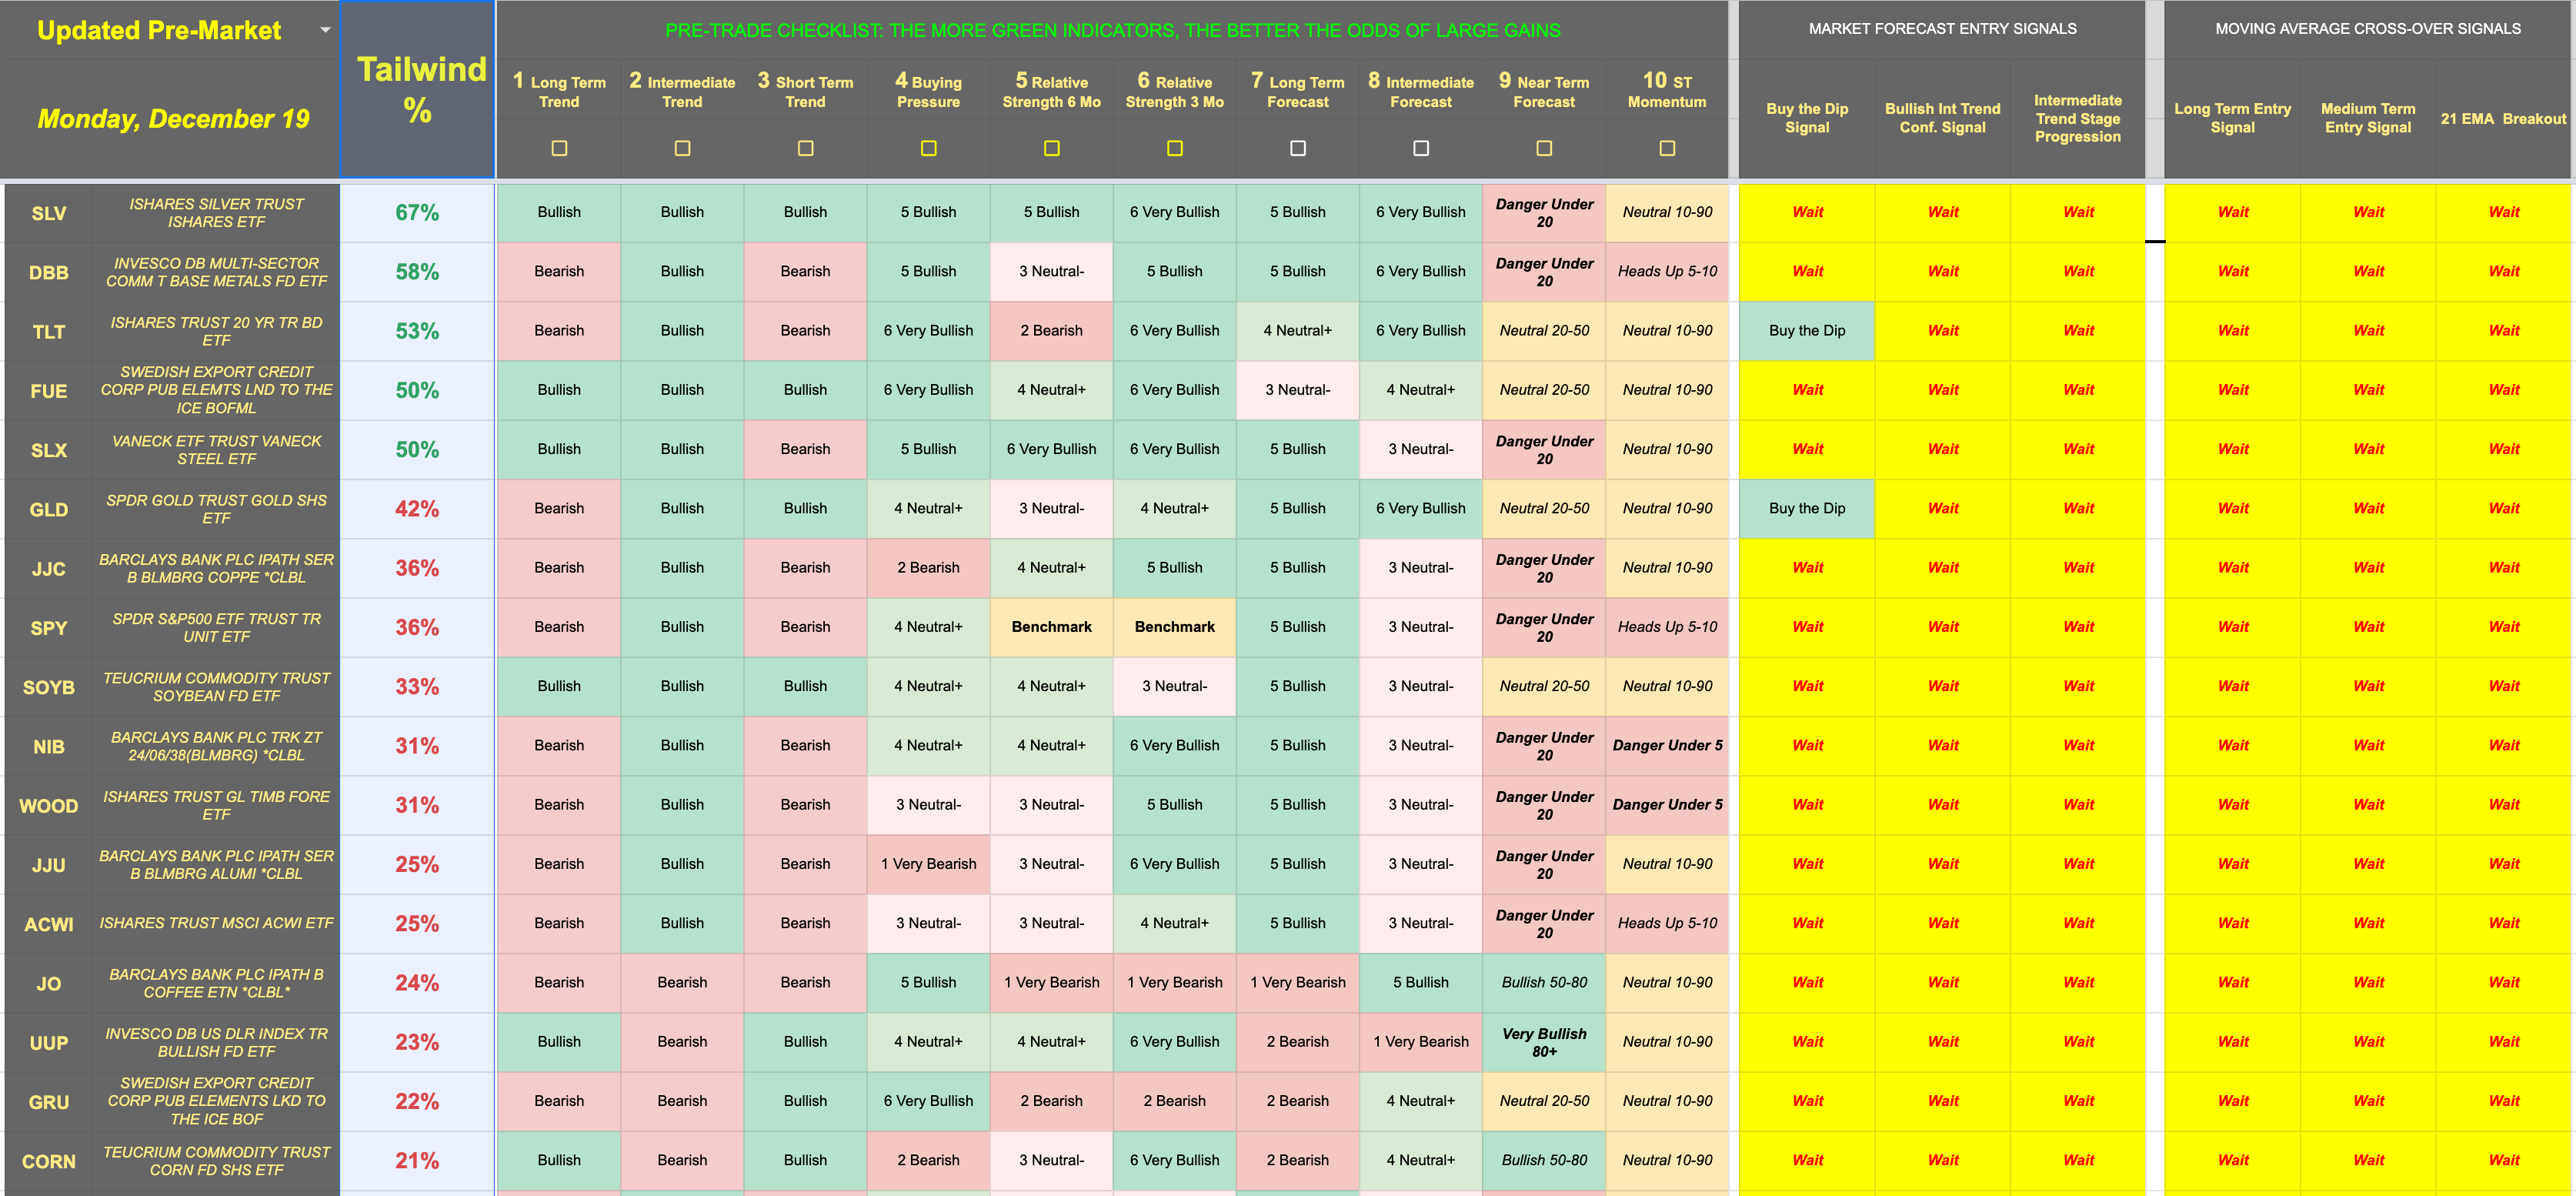
Before throwing up the paywall, I want to offer all subscribers a holiday gift. Here are trading signals for Monday, covering the major commodity ETFs that we track. What this stack portends for the economy and stocks overall is pretty ugly, but there are two buy-the-dip signals worth paying attention to. They remind us of what worked bullishly during the market crash of late 2007 to early 2009. If ever there was evidence that the inflation fight was over and the Fed has now tightened to the point where it’s helping to (pick your action verb) ease, crash, plunge, slam, plummet or nuke the US economy into a serious slowdown or worse, here it is in a sea of red.
Commodity ETFs
These ETFs are tied to futures contracts and aren’t designed to be held for long periods of time. I use the commodity stack mainly to inform my stock trading and investing as a leading indicator. The red contagion is telling for stocks.
For example, DBB is the ETF for various base metals which are used in industrial manufacturing. The post-COVID demand distortion resulted in a fairly robust run for industrials over the past two months and DBB (58% Tailwind Score) has been a leading indicator for the stocks in that sector. The industrial ETF XLI, for example, has run from the low 80’s to the low 100’s since mid-October, but that trend appears to be weakening, and DBB confirms the potential beginning of a demand slowdown for companies in XLI. This is very preliminary but worth noting.
DBB''s overall Cheat Sheet metrics are still very strong, but along with many subsectors and industry groups, the key performance indicators are beginning to flash red in the very near term. In fact, a look at Factors 9 and 10, the market forecast junior time-frame indicators for DBB, is pointing to likely downside follow-through next week. Demand may be starting to wane. XLI’s market forecast is worse, with the near-term downward momentum having spread to Factor 8 (the intermediate market forecast, which too has turned mildly bearish). DBB includes the industrial metal Silver, which I think may decouple from other base metals and continue a bullish run. So, there’s a risk in relying too heavily on DBB as a leading indicator, as its performance may be distorted by Silver..
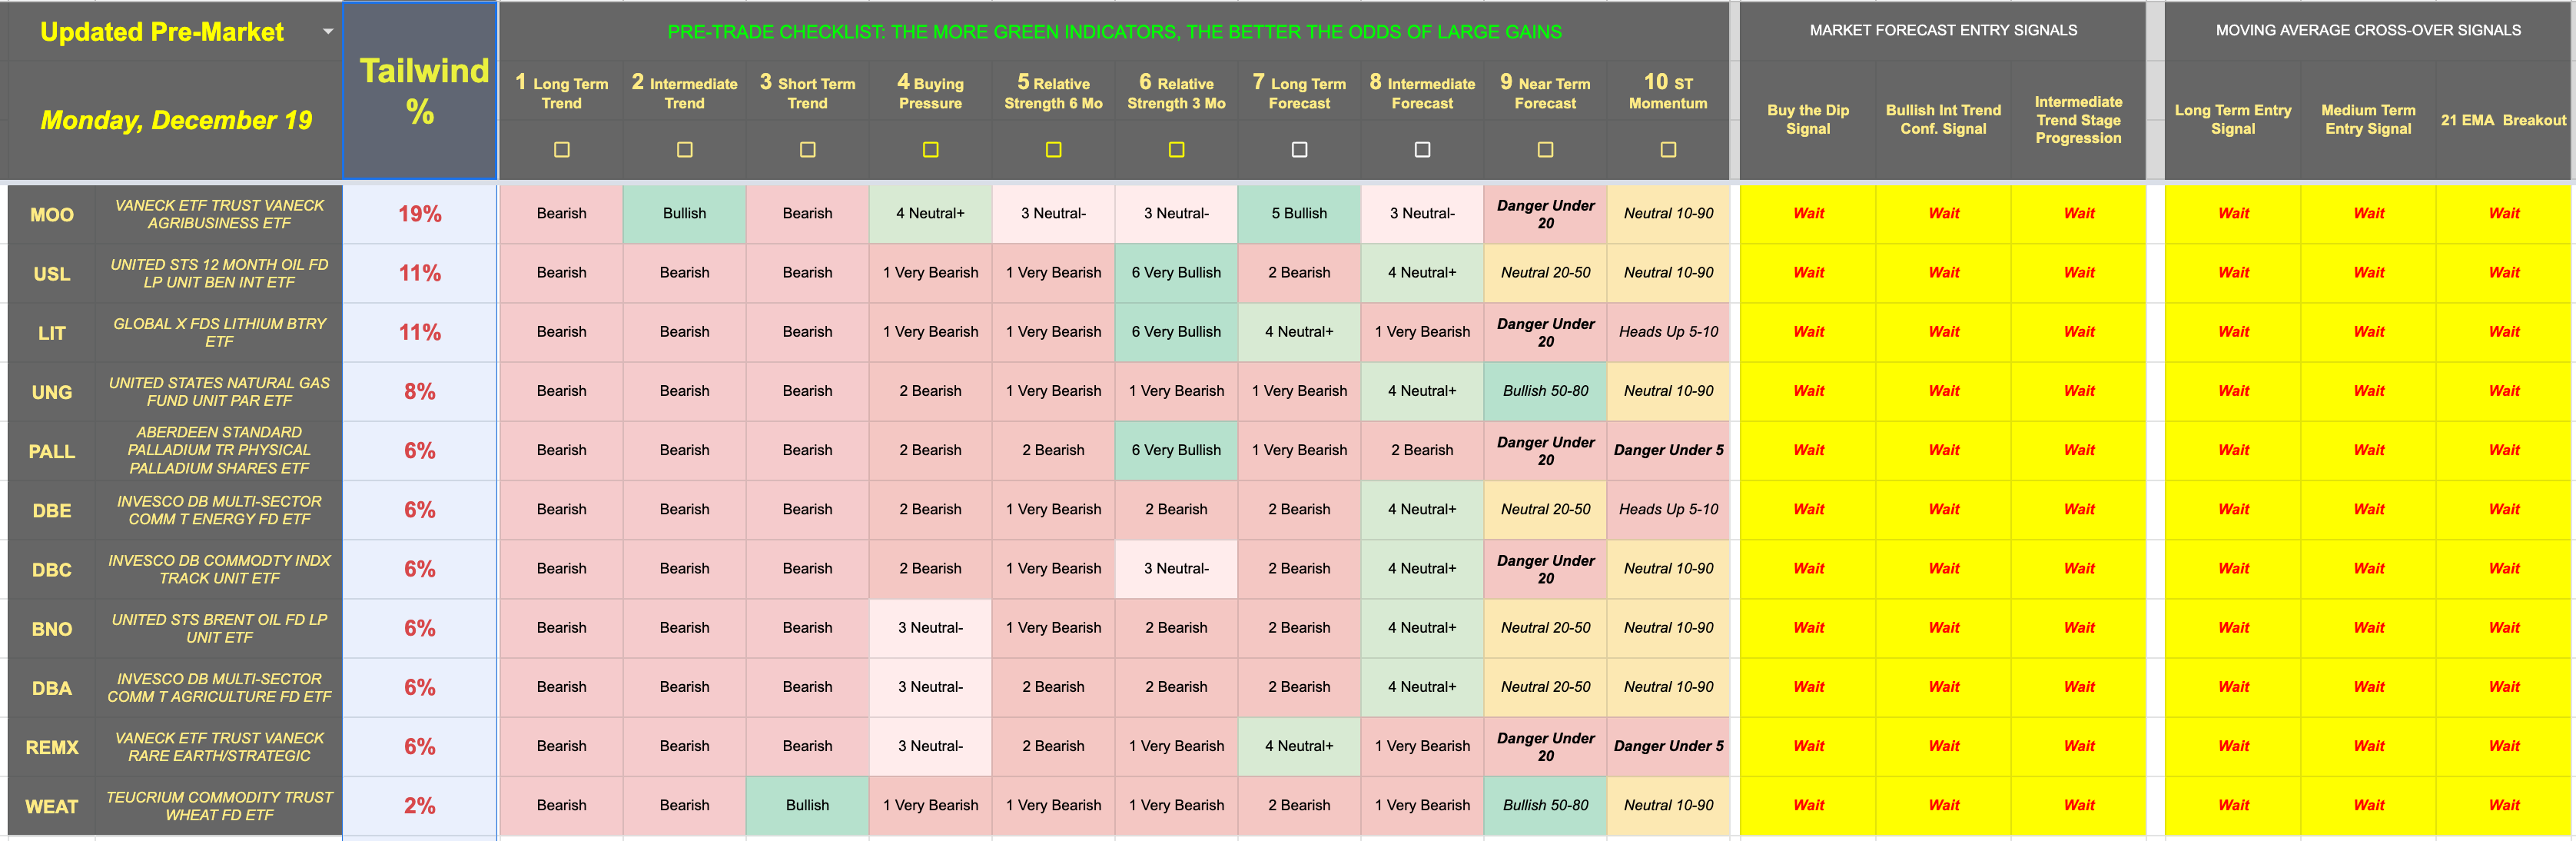
Remember, all this weakening is what’s taking place with the very best-performing commodities. Energy ETFs and Energy related stocks look far worse. Part of what’s going on is demand-related. However, I’ve stuck the dollar ETF (UUP) into the commodity stack above. Overall most instruments have been weak for the past several weeks (or longer) but UUP bounced up as the result of the Fed’s hawkish reinforcement of its rate intentions last week.
A strong dollar can impact key commodity prices negatively, which are priced around the world in dollar terms. So, the commodity ETF indications aren’t necessarily binary. It’s more three-dimensional because of the role of the dollar as the world’s reserve currency. But in a rising rate environment designed to curb economic demand and throw some people out of jobs as an inflation reduction strategy, commodities and especially their ETF counterparts are a great leading indicator for economically sensitive parts of the market. They will lead stocks down if the next downward leg for equities, which I fear to be a done deal, materializes.
I wrote about Silver (ETF SLV) extensively yesterday. It’s trying to break through a key long-term diagonal resistance, and the “Danger Under 20” (Factor 9) reading of the Near Term market forecast is a reflection of that struggle. All other Cheat Sheet metrics are bullish for SLV, and I’m bullish on silver as both a hedge against a Fed-induced financial crisis and its use as an industrial metal, particularly in the Green Energy sector — the one part of the market best able to withstand the Fed-induced economic shitstorm to come.
Gold (GLD) has modesty bullish Cheat Sheet metrics as well, despite a tailwind score below 50. Its buy-the-dip signal is valid and senior time-frame market forecast indicators are in bullish agreement. Gold, and the broader precious metals complex, are positioned to run for the next several months — never in a straight line upward, of course. If my prediction about the Fed overtightening by several magnitudes comes true, I expect precious metals to do very, very well following 2008’s playbook.
One other notable signal is TLT, an ETF I included in the commodity stack purely for comparison purposes. It’s run up $15 since bouncing off a double-bottom at $93. It’s pulled back from its highs of $109 and may be in for a period of consolidation. Although mired in a long-term downtrend, the buying pressure on TLT is Very Bullish, and a break above $109.50 could result in the continuation of a multi-month trend that eventually reverses the long-term course for bonds. I’m certainly not predicting that kind of turnaround, but I am confident that treasuries will run as panic over the Fed’s nose-blind policy stance on the decaying corpse of US stocks mid-summer. . We’re early here. TLT will be climbing a wall of worry to deliver the kind of bullish returns I foresee as possible when stocks crater. But I will use actual data, rather than rely on speculation when taking action. I’m simply painting the picture to formulate my strategy.
TLT will rise in anticipation of the Fed rate cuts to come. My rather lengthy stock market forecast missive was issued yesterday, and it calls for the Fed to break something in the economy that, in turn, induces a panic-stricken course reversal sometime in early Q3 2023. As the Fed realizes it has unnecessarily nuked the US economy with its unprecedented cluster of 50 to 75 basis point rate hikes, the printing presses will run once more and the central bank will once again become the US Treasury’s primary customer, buying bonds hands over fist. I believe market participants have begun to accumulate 10-year notes and other government instruments in anticipation of what’s to come.
However, you can throw out all the long-winded spew from a dude on the internet and simply pay attention to the cheat sheet data. That’s what matters. But the precious metals/T-bill setup is reminiscent of the 2008 Bear Market. While most stocks cratered spectacularly during that time, these vehicles enjoyed a significant upside. I’m watching closely and have plans to accumulate both ETFs.
