Relative Strength

Wall Street pundits continue to warn of a coming severe downturn, and caution that the rally in stocks we’ve enjoyed the last couple of months will soon come to an ugly end. They point to three key factors.
First, the economy is already slowing, as evidenced by a weak commodity market and flattening inflation data, driven by demand destruction.
Second, consumers have been absorbing this year’s higher food, rent, staples, and energy costs by carrying more debt. Americans added $46 billion to credit card balances in the second quarter of 2022, according to the Federal Reserve Bank of New York’s Center for Microeconomic Data. That’s unsustainable and is likely to lead to a consumer spending slowdown.
Third, they predict the Fed will be oblivious to the obvious signs of economic slowdown and will continue to hike rates aggressively, which in turn will have a further depressing effect on the economy.
There’s a fourth factor not too many are talking about, because no one truly knows the extent of the contagion that’s possible. It’s China’s credit & banking crisis, which some say has the potential to spread around the world and wreak economic carnage worse than the fall of the Leahman Brothers in 2008.
I’ve been sharing how Cheat Sheets’ Trading Signal data can act as an early warning system for major market posture shifts, and I even sent out a heads up yesterday to watch how we close. I’ll update that data before the beginning of the trading week.
Here, I wanted to share our weekly Relative Strength Rank and Trend reports, and show you how they can complement Cheat Sheet Trading Signals as part of that early warning system.
I’ve blogged extensively about how relative strength data helps traders and investors anticipate where we are headed, rather than we are at the moment since relative price movement will often precede directional price movement. If sector and index ETFs were automobiles, these reports can show which are speeding up and slowing down, before the cars start actually passing each other on the highway.
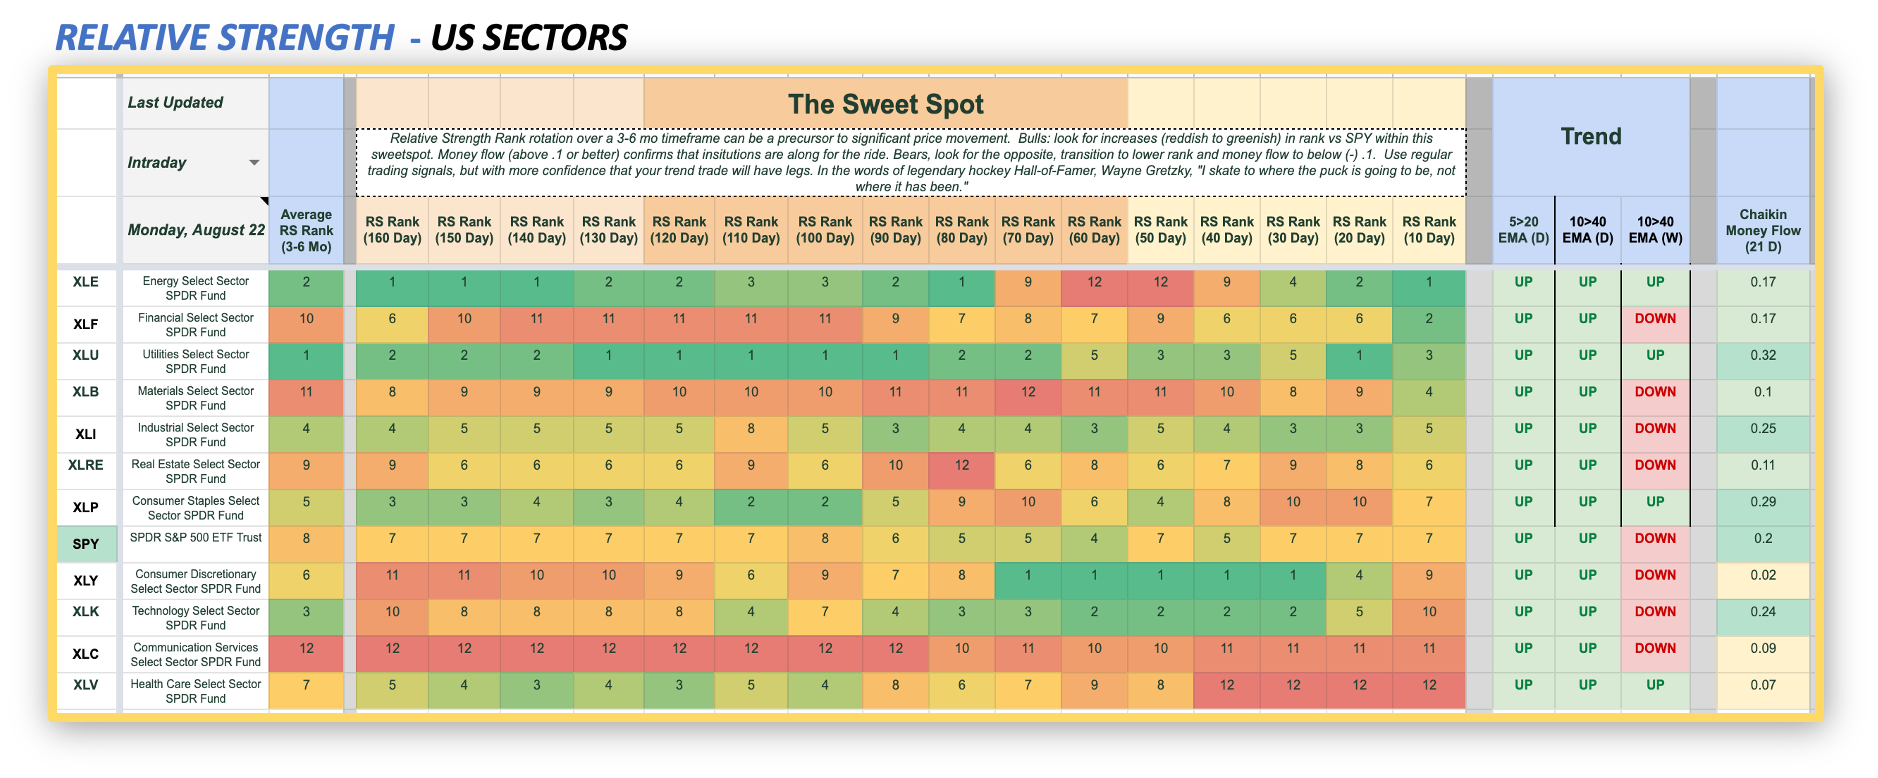
When assessing the potential for market beairshness using the RS Cheat Sheet stacks above and below, do the following:
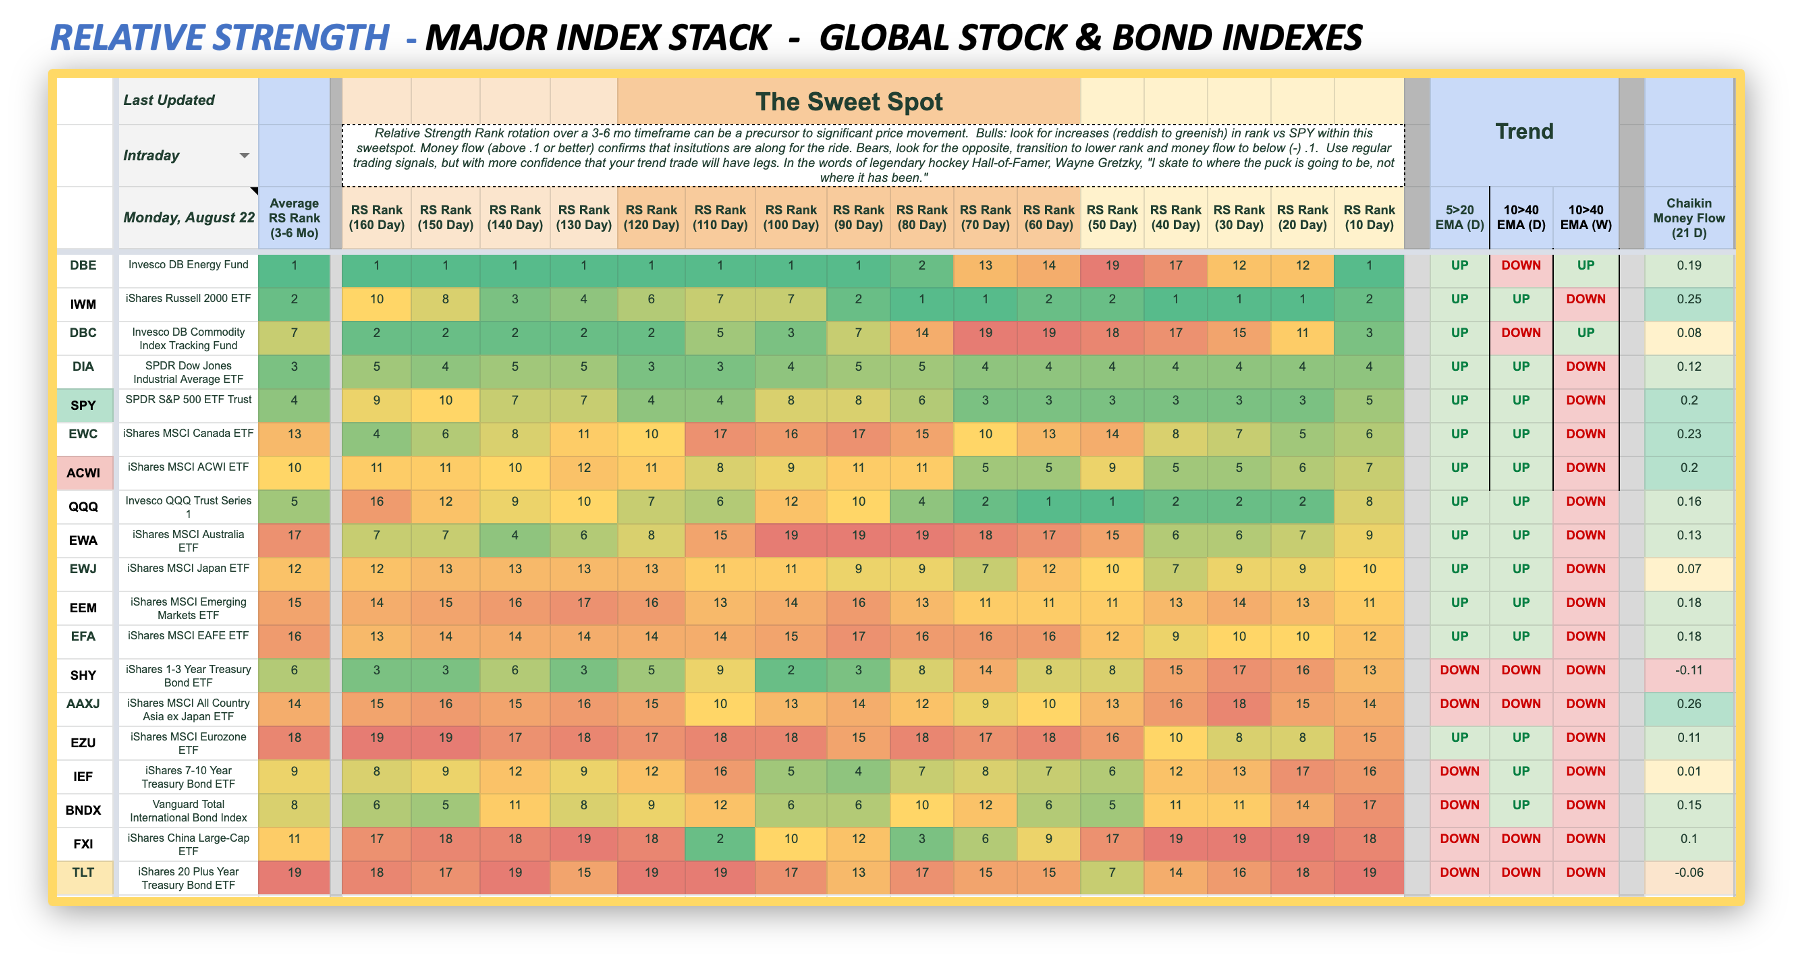
Check Chaikin Money Flow (also called buying pressure) on the far right. Readings over .1 are bullish. Readings over .2 are very bullish. When money flows are strong, even an intermediate price pullback and consolidation aren’t likely to result in an all out trend reversal. As long as Money Flow stays bullish, I’ve got more confidence buying dips or even pullbacks lasting a few weeks. The Russell 2000 ETF (IWM) has very bullish money flow at .25, the S&P 500 ETF is also very bullish at .2 and the QQQs money flow is bullish at .16, though that’s down from very bullish readings earlier this summer. During the week, watch Cheat Sheets Index Trading Signals Stack and pay attention to the “Buying Pressure” column. If any of these ETFs move from where they are at now to Neutral - or worse, that would indicate some more serious weakness is at hand. But price pullbacks with buying pressure/money flow in tact are buying opportunities.
Pay attention to the average relative strength rank over the past 3 to 6 months (column on the far left after the ticker description). Higher ranking securities have rotated into favor and are showing persistent strength if their relative rank puts them in the top 1/3 of all equities in the stack. For example, DBE is an ETF tied to energy futures for light sweet crude oil (WTI), heating oil, Brent crude oil, RBOB gasoline, and natural gas. 70 days ago, energy commodities rolled over and have pulled back significantly. It’s only been a week and a half, but we should pay attention to the fact that DBE has bounced up as the top relative performing index we track for the past 10 days. Does this mean it’s exploded higher? No, this was a down week for most stocks, and DBE simply traded sideways but outperformed stocks. This is what I mean when I say that RS changes can be a precursor to price changes. We should watch this one closely. If it starts showing high relative rank for 60 trading days and not just ten, we’d call it persistent strength and a precursor to a potential new bullish trend in energy prices. That won’t happen in a crashing economy. Energy prices would go lower. DBC is a broader commodity index than DBE, but the story is the same. Note its money flow is only Neutral +
Pay attention to green to red, and red to green transitions that take place through the sweet spot. Right now DBE’s transition is bearish, meaning the fund has been rotating out of favor, beginning between 80 and 70 trading days ago. That transition is more important than what’s taken place in the most recent 10 days. The All Country World (Stock) Index ACWI has also rotated into favor within the sweet spot, albeit at a slower rate compared to US equity indexes. It nevertheless has made a significant Relative Strength rotation from 11th to fifth. No signs of relative weakness or rotation out of key equity indexes IWM, DIA, & SPY based on the relative performance. No real flight to safety transitions into bonds have taken place either. QQQ is a little weaker, making it an ETF we’ll want to track closely.
So, overall, despite the week’s stock weakness, we don’t see major indications of aggressive selling at the global index level.
As far as the US goes (below), we are seeing an early indication of energy (XLE) rotating back in favor. It bears watching, but until the bullish rotation hits the sweet spot, it’s too early to draw inferences about another major leg up in energy prices. But that would reflect increasing economic demand, rather than contraction.
XLU is persistently strong, with a very bullish money flow score. Consumer Discretionary (XLY) and Tech (XLK) have begun a bearish rotation, and XLY is now showing only neutral money flow. No signs of the apocalypse, but if markets are to reverse, these ETFs are likely the ones to lead us lower. We’ll need to watch closely.