

Relative Strength Sunday
Relative Strength Rank & Trend Reports to Help You Anticipate the Next Group of Up-Trending Asset Classes. Plus, a new "Quanta-Mental" Killers Stock for Premium Subscribers (Entry Signals)

It’s Relative Strength Sunday Here On Stock Cheat Sheets
Relative Strength Rank & Trend Trend Stack User Guide - Click Here
Relative price strength is an indicator of price momentum. A higher relative strength rank is always desirable, especially when performance exceeds that of an industry group, sector, index or other benchmark - ie when a stock outperforms the market.
RS should not be the sole determinant used when stock-picking. Other indicators built into Cheat Sheets Data, such as moving average posture, money flow and the Market Forecast’s multi-time frame momentum oscillator are also key parts of 10-step pre-trade technical indicators that combine to form powerful signals.
Why do traders and investors value Relative Strength? Because they believe it provides insight into future price momentum. Stocks with increasing relative strength rank are assumed to continue increasing. In addition, relative strength trends are considered precursors to actual trends, and once they start unfolding, other investors are “attractivated”, lured by the unfolding trend enough to take action. Strength begets strength.
Relative Strength is often a self-fulfilling prophecy. Relative Strength Analysis, therefore, helps us “skate to where the puck is going to be” by anticipating a trend before it unfolds.
For best viewing, click to enlarge each stack and view it on a computer. If your email client cuts off the last few cheat sheet stacks in email due to file size limits, remember you can always press "See More" to view the rest of your email as a published blog on stockcheatsheets.substack.com. EDITORS NOTE: All STACKS BELOW WERE RUN JUST PRIOR TO MONDAY APRIL 17TH - NOT MONDAY APRIL 10TH AS LISTED BELOW
Global Stock Relative Strength Trend
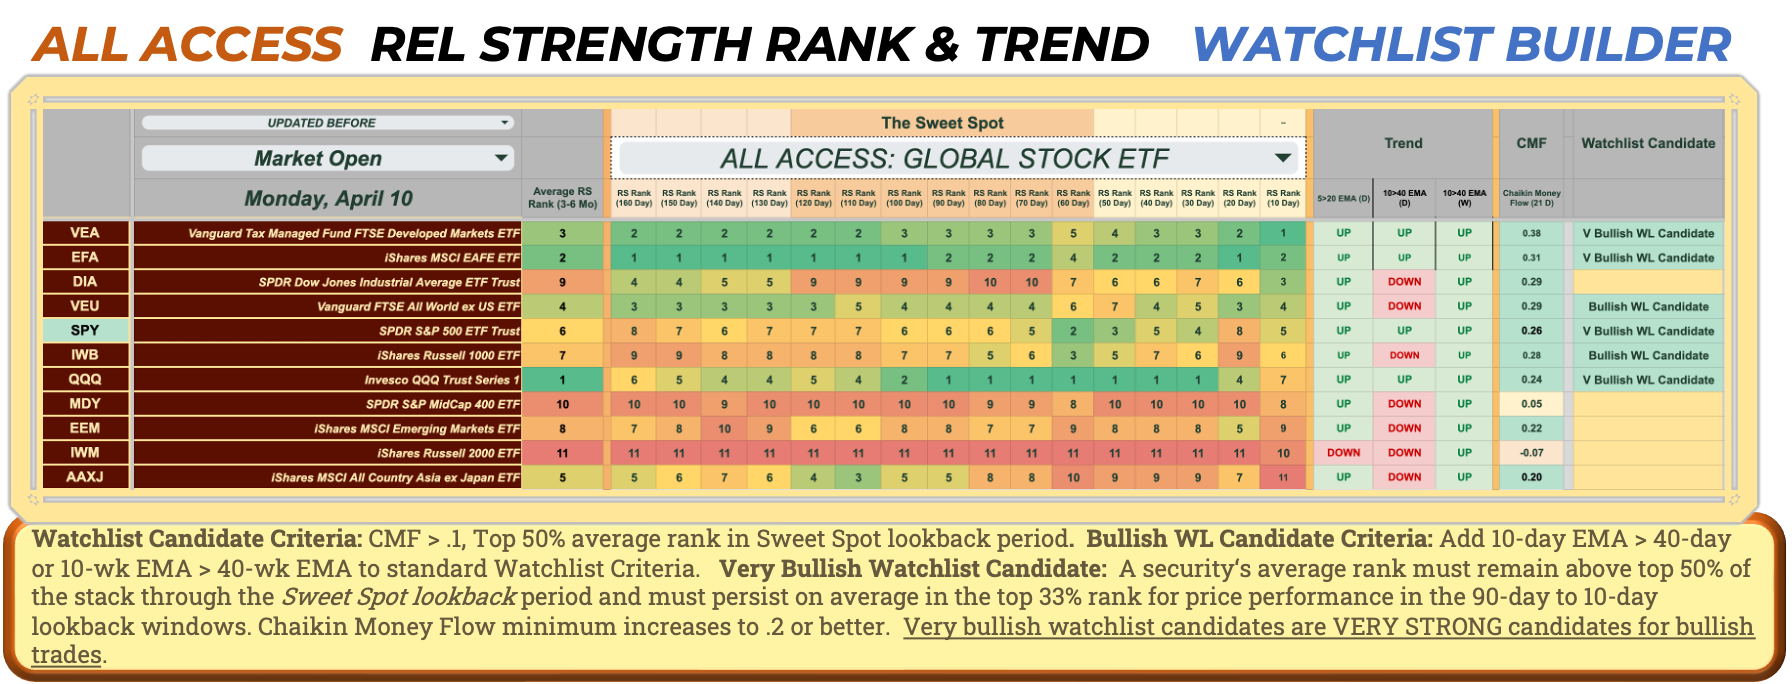
The ROW (“Rest of World”) investing theme is alive and well. Developed market ex-US ETFs, VEA and EFA, have been persistently outperforming , with an average rank of 3rd and 2nd respectively during the critical 60 to 120 day look-back period.
With money flow making aggregate gains in ETFs around the world, we suggest you place strong emphasis on Very Bullish Watchlist candidates (label: V Bullish WL Candidate)
Relative strength must carry a high enough average rank to place the ETF in the top 50% through the Sweet Spot look-back period of 60 to 120 trading days.
Average Relative Strength rank must improve so that the ETF finishes in the Top 33% across the 10-day to 90-day look-back periods
Exponential Moving Average Pairs must both be bullish. Both the 10/40d EMA and the 10/40w EMA must read UP. The shorter moving average must be higher than the longer moving average in both the daily and weekly aggregation periods. In other worse, the ETF must be in an established bull trend in both time periods.
Money flow must be above .2
Bullish Watchlist candidates differ only slightly and represent the next best group: Only one of the two moving average pairs must be bullish and the money-flow threshold is .1 or greater.
Global Multi-Asset-Class Relative Strength Trend
In this stack, in addition to global equity ETFs, we add asset classes such as precious metals, energy commodities, agricultural commodities, and fixed income This stack, more than any other, will allow you to be the smartest person at the cocktail party — and to get in the last word as you grab the final full champagne glass off the circulating tray. This stack is ahead of the reality and shows you where prices are headed globally.
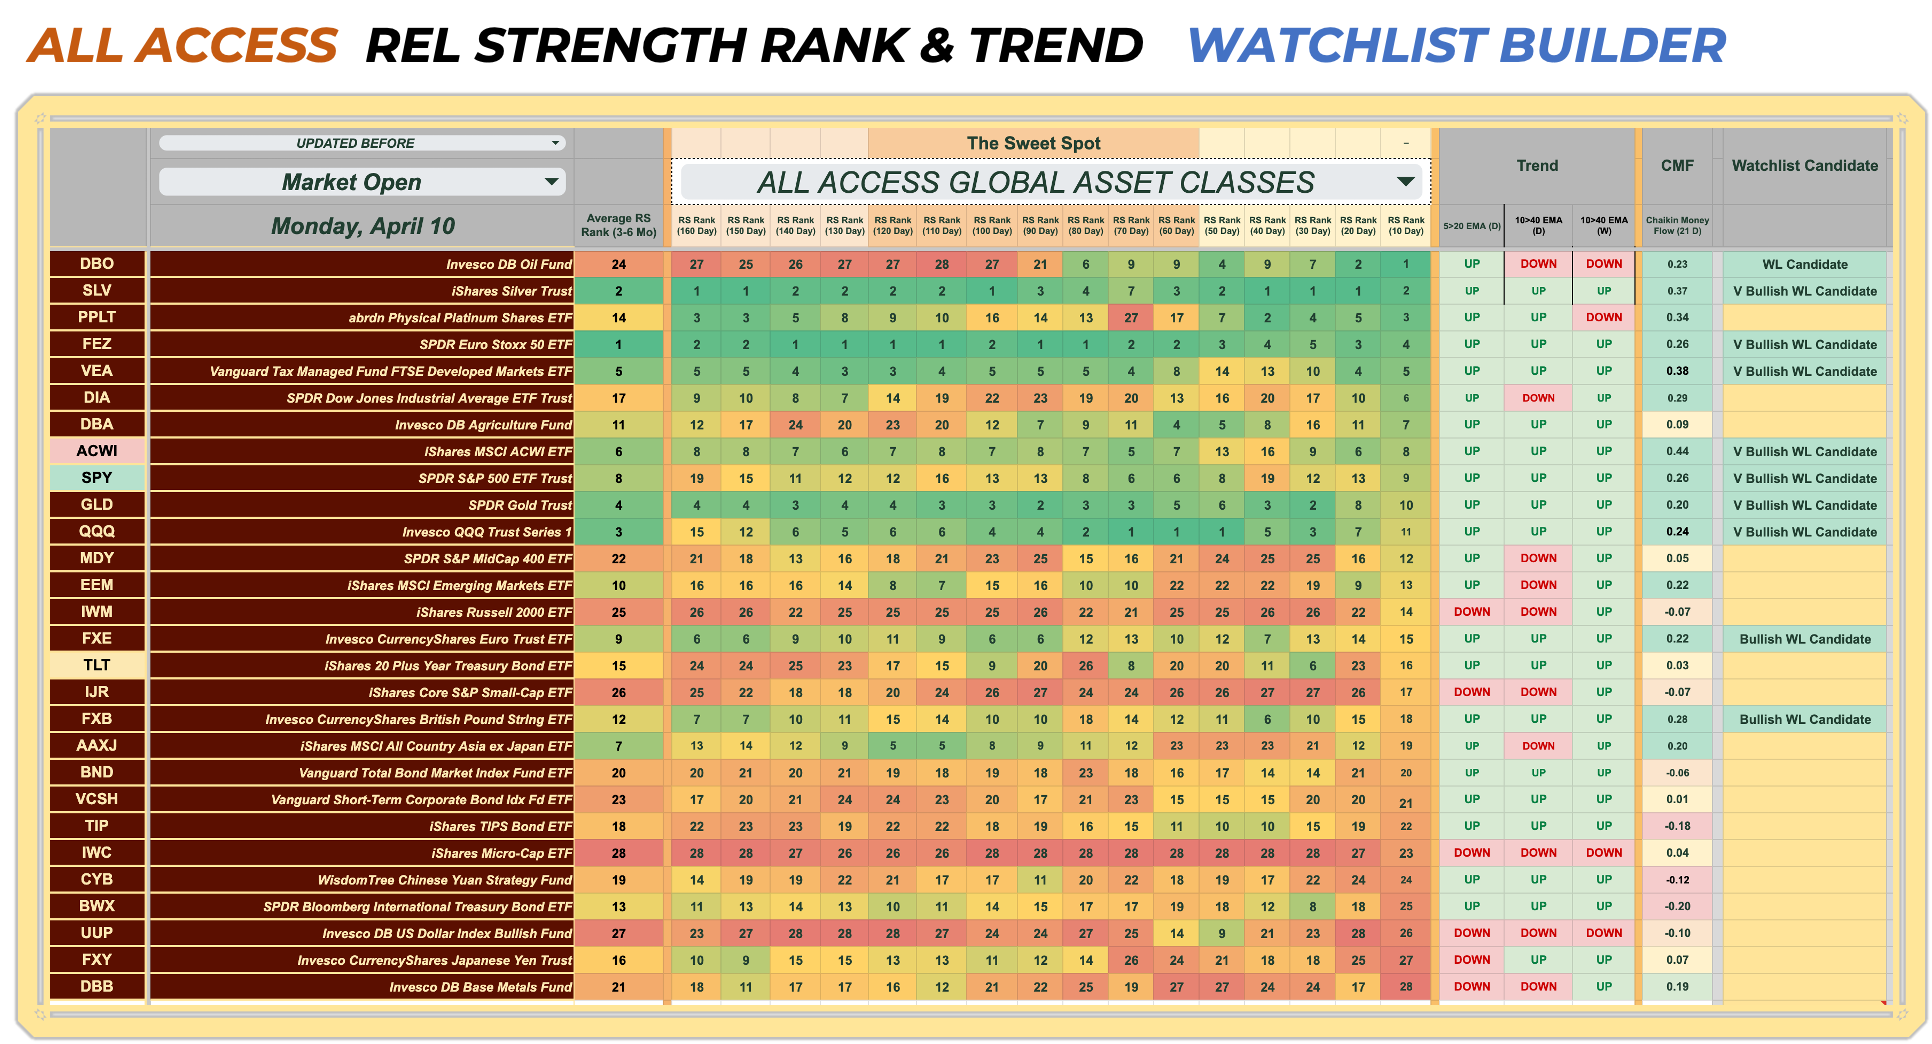
Oil ETF DBO has no established trend, but is worth watching. Oil prices are on the rise, and this ETF has transitioned from 28th to 6th within the sweet spot look back period, and in the past 90-day look back period, it has transitioned from ninth rank to first. That’s quite a relative price acceleration. You can be sure that higher prices at the pumps will be a front-and-center topic when Memorial Day rolls around here in the U.S..
Silver and Gold are showing persistent relative strength trends and and bullish trend postures in multiple time frames. Gold has weakened slightly over an inconsequentially short time frame. Look for any buy-the-dip entry opportunity on precious metals.
Base metals, the lynchpins of heavy industry on the other hand, look terrible.
Large Cap Tech in the US (QQQ) continues to punch above its weight. The slight weakening in relative strength the past couple of weeks also favors a buy-the-dip outlook , especially with money flow remaining above a Very Bullish reading of .2.
Aside from the assets we’ve mentioned previously, most other global assets are underperforming benchmark stock indexes SPY (US Large Caps) and ACWI (The All Country World Index) . Major global currencies are in a race to the bottom as the dollar (UUP), yen (FXY), yuan (CYB) fester. That bodes well for asset prices in relative terms.
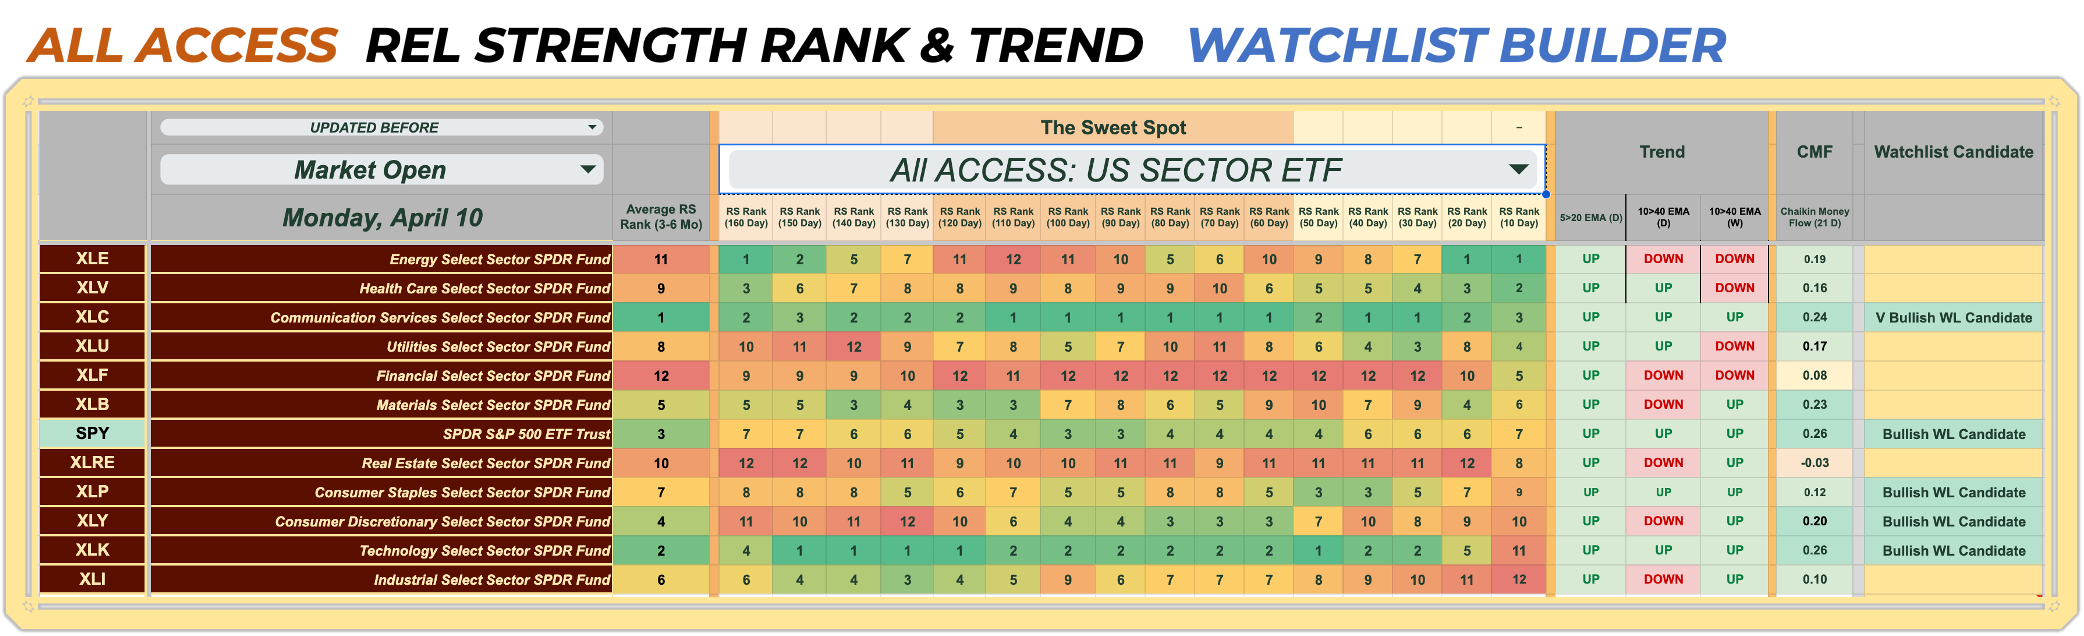
US Sector Relative Strength Trends
US energy companies are just now beginning to move higher with oil prices. Otherwise, US Tech (XLK) and Media Tech and Telecom ETF (XLC) are the only other sector ETFs showing persistent strength. XLK has fallen back in the last couple of weeks, so we’ll want to look for any canaries in the coal mine in the subsector ETF stack. Money flow, bullish trends in multiple timeframes and persistent relative strength in the sweet-spot collectively maintain XLK as worthy for any buy the dip signals
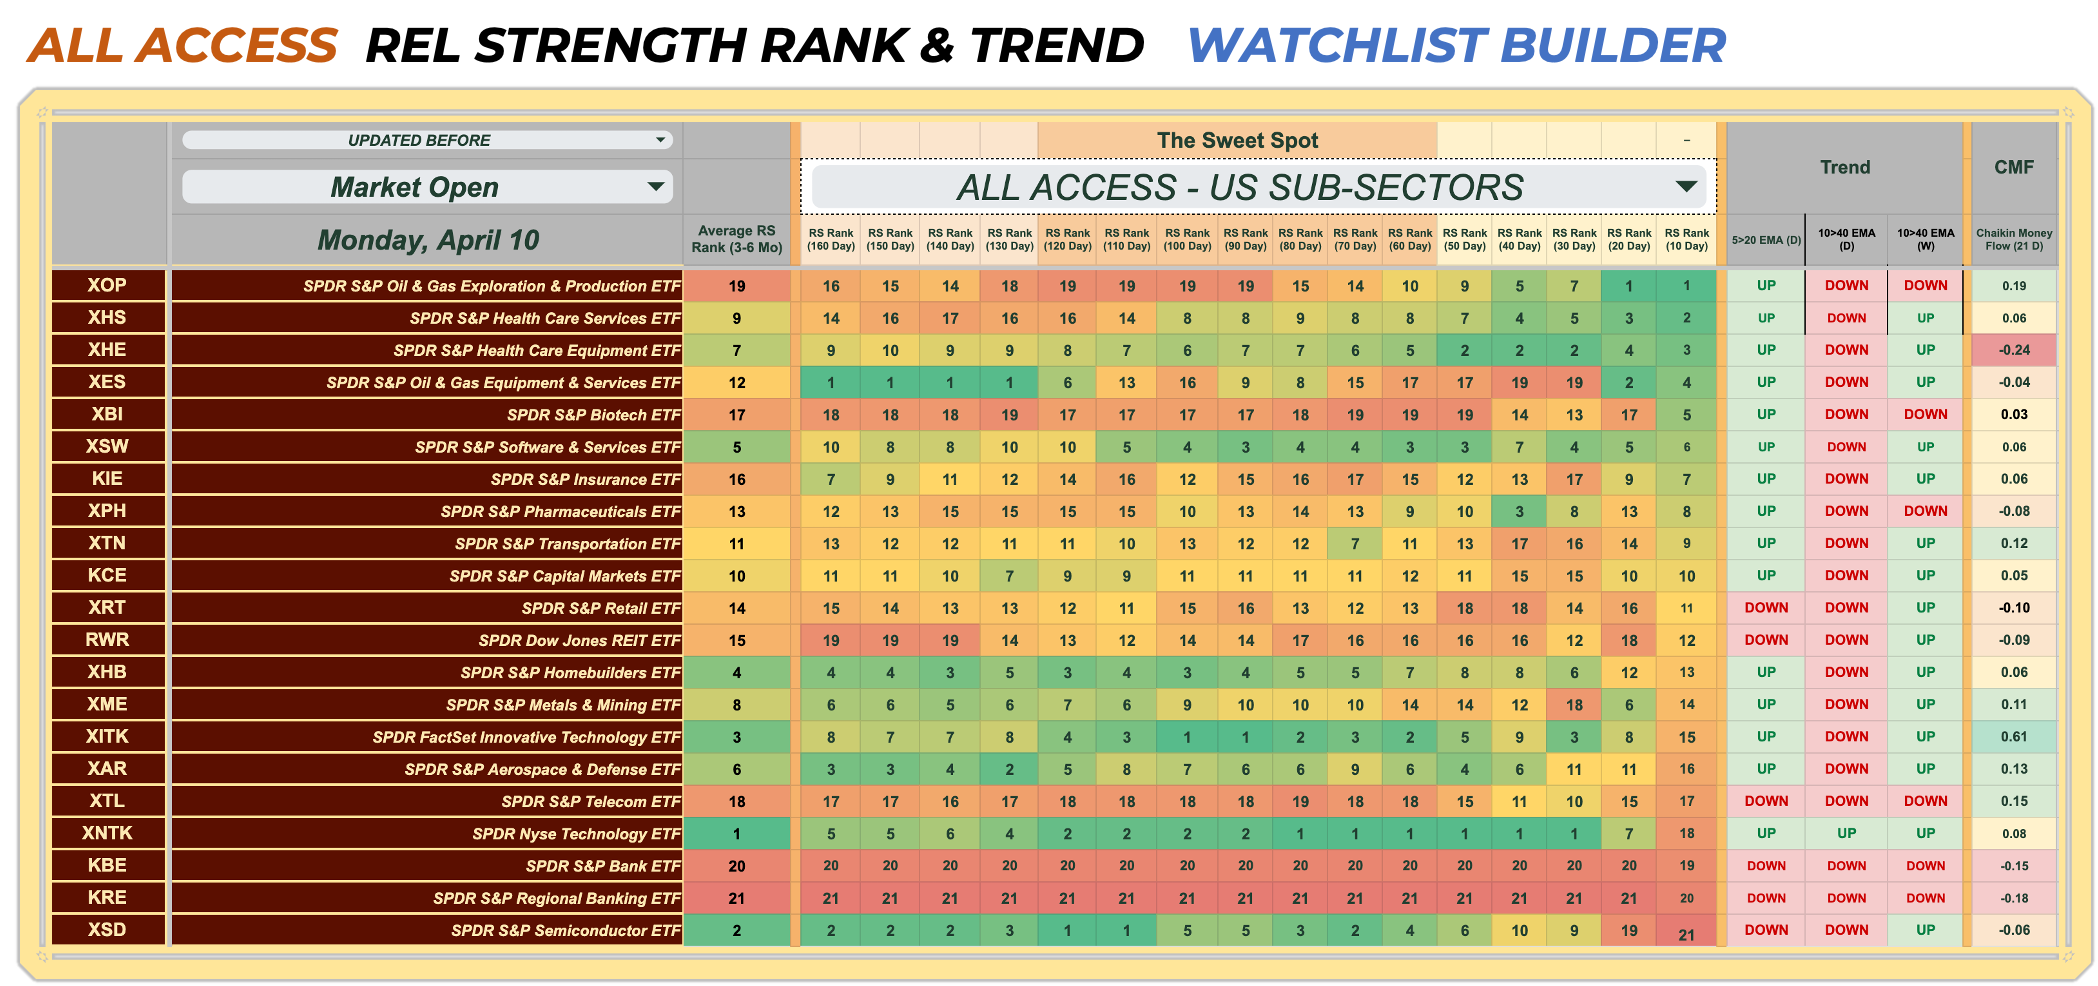
US Sub-Sector Relative Strength Trends
Oil exploration and production (XOP) is the fastest moving subsector within the energy sector to benefit from the rising oil prices. 19th to 10th rank elevation across the sweet spot, 10th to first over the past 90 days, and a bullish .10 Money Flow reading. Institutions are building a position in XOP or related stocks.
The rise in tech subsector ETF XSW (Software and Service) is offsetting the decline in semi-conductors. Investors spooked by Warren Buffet’s sale of semis, because he believes prospects for war with China are too great to keep holding, seem to be rotating out of XSD and XSW.
Cheat Sheets is a data service to help traders improve decision-making. The author/architect of Cheat Sheet Sheets shares educational concepts related to the skill of trading but will not dispense personal financial guidance. All trades showcased are for demonstration purposes in a simulated investing environment. All-Access Members enjoy a no-charge subscription to Cheat Sheets. You’ll receive Market Conditions Stacks, Global Relative Strength Rank & Trend Reports, and US Sector/Sub-Sector Trading Signal Stacks delivered to your inbox at least twice every week (or more often). Cheat Sheets are headlights you’ll need about which way the markets are headed.Premium Cheat Sheet Stock Stacks:
US Industry Groups
Standouts in this US Industry Group Relative Strength Stack include:
BLOK is an actively-managed ETF comprised of companies involved in blockchain technology;
SIL is a targeted play on silver mining.
The SPDR Global Infrastructure ETF seeks to provide investment results corresponding to the 75 largest infrastructure-related stocks based on float-adjusted market cap and liquidity. It has a doozie of a money flow score.
