Weekend Watchlist Builder - Relative Strength Rank and Trend Reports

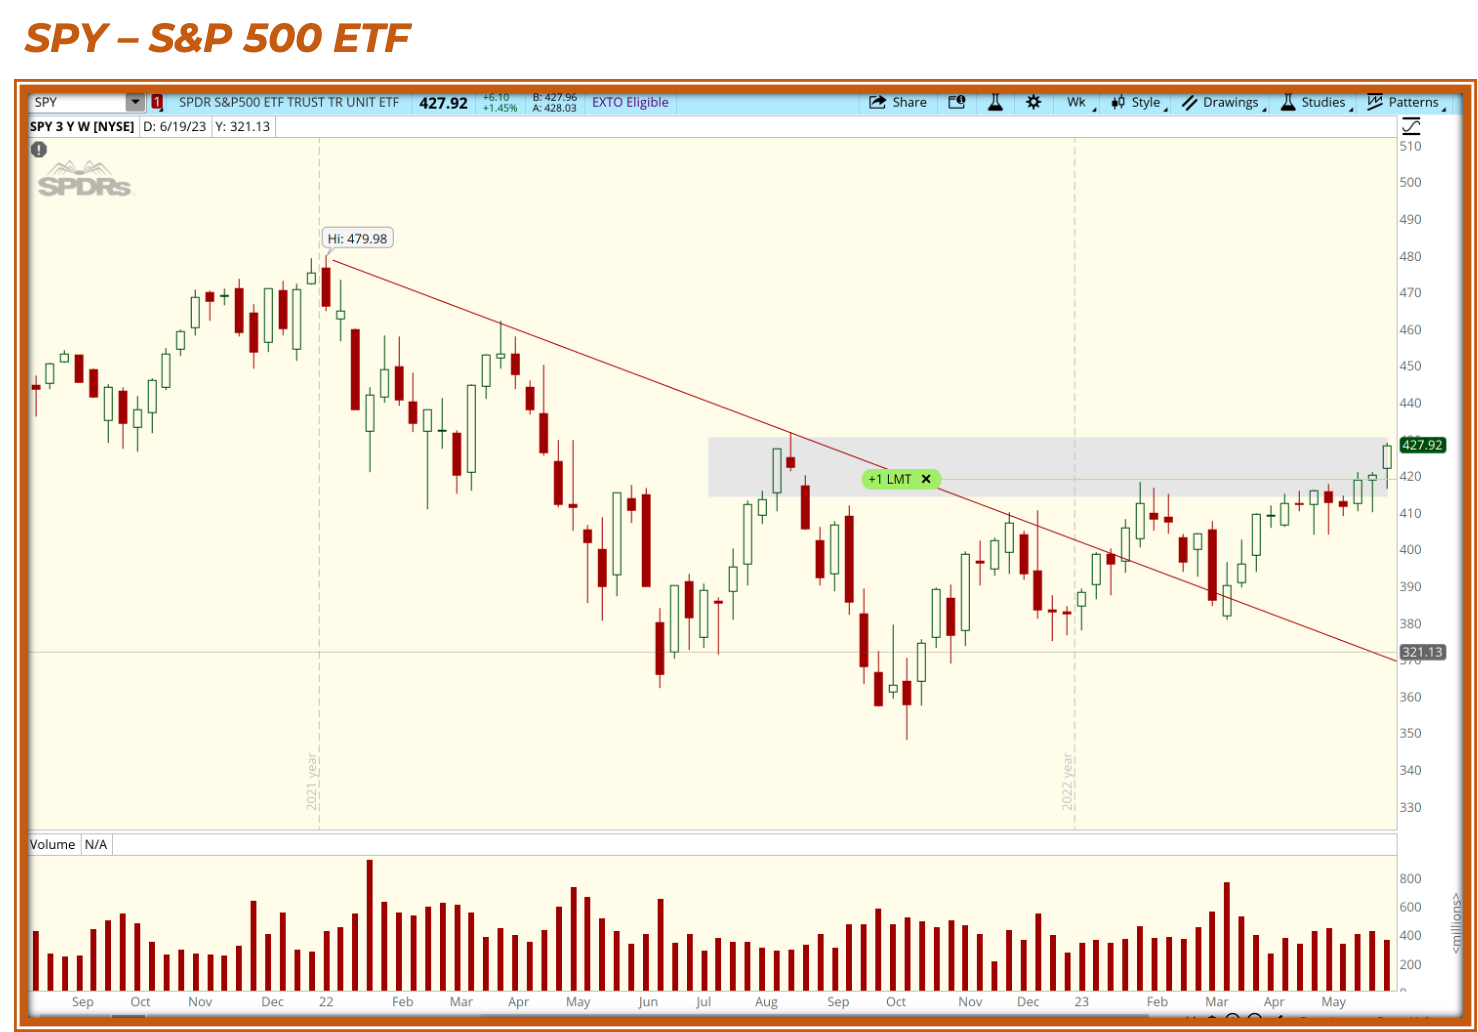
US Large Caps broke out and then traded right up to the next level of resistance last week.
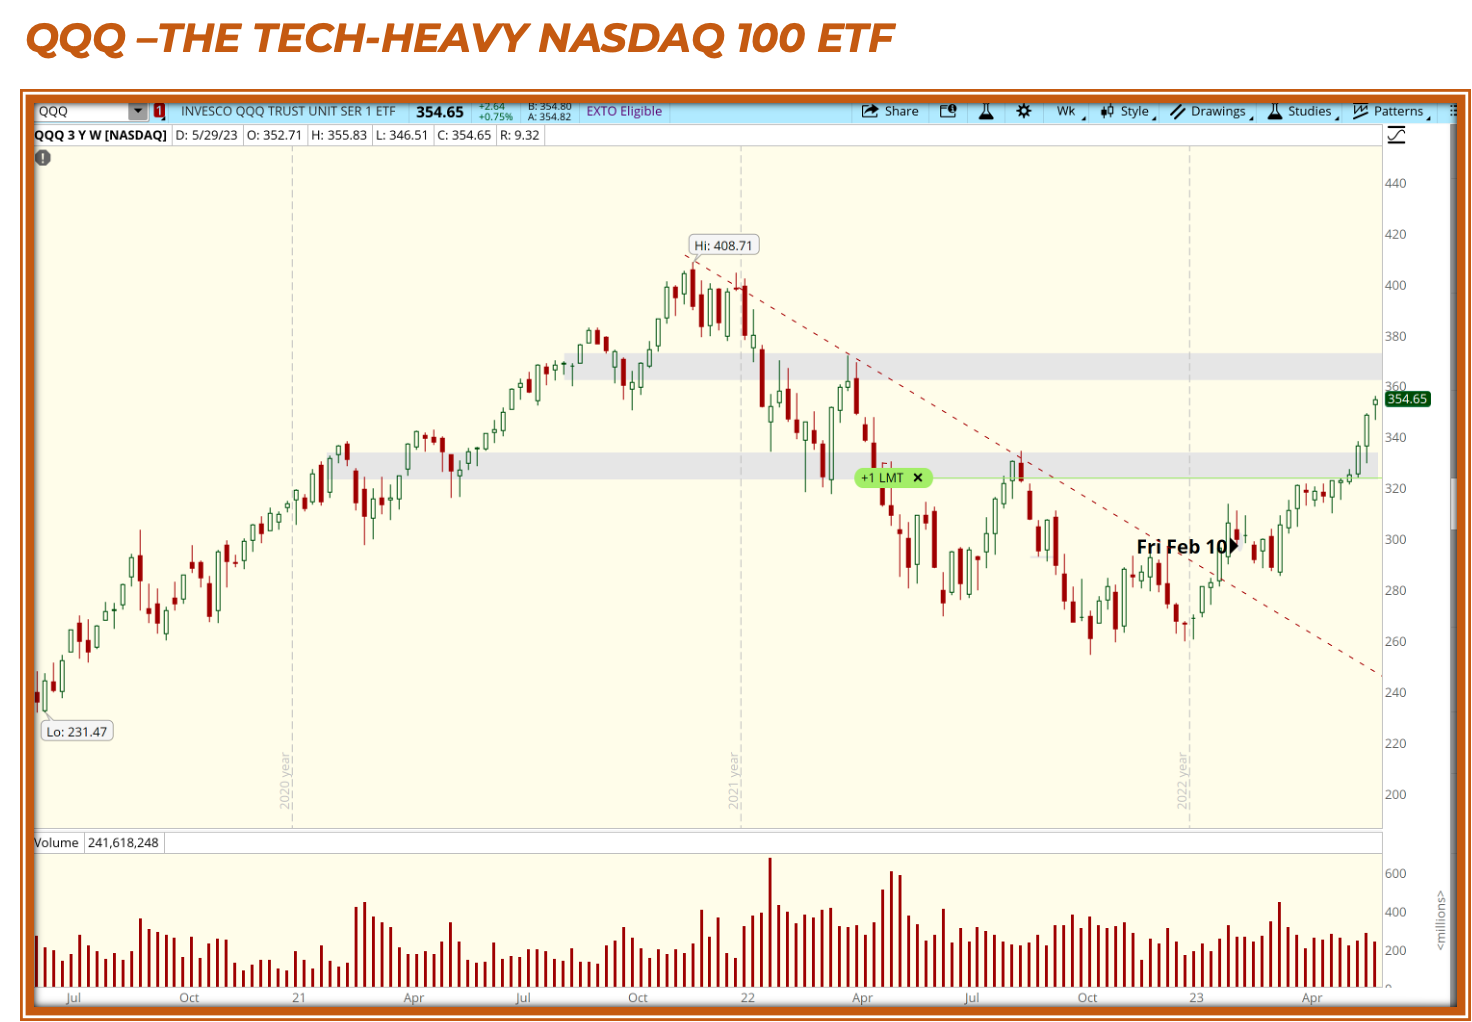
The Nasdaq 100 (QQQ) continues its explosive run. Is a pullback re-test of former resistance as new support in the cards? Traders who were scared out of the market by the debt-ceiling panic-that-never-happened would certainly like another bite at the apple. Or are we going to melt up through the next level resistance like a hot knife through butter?
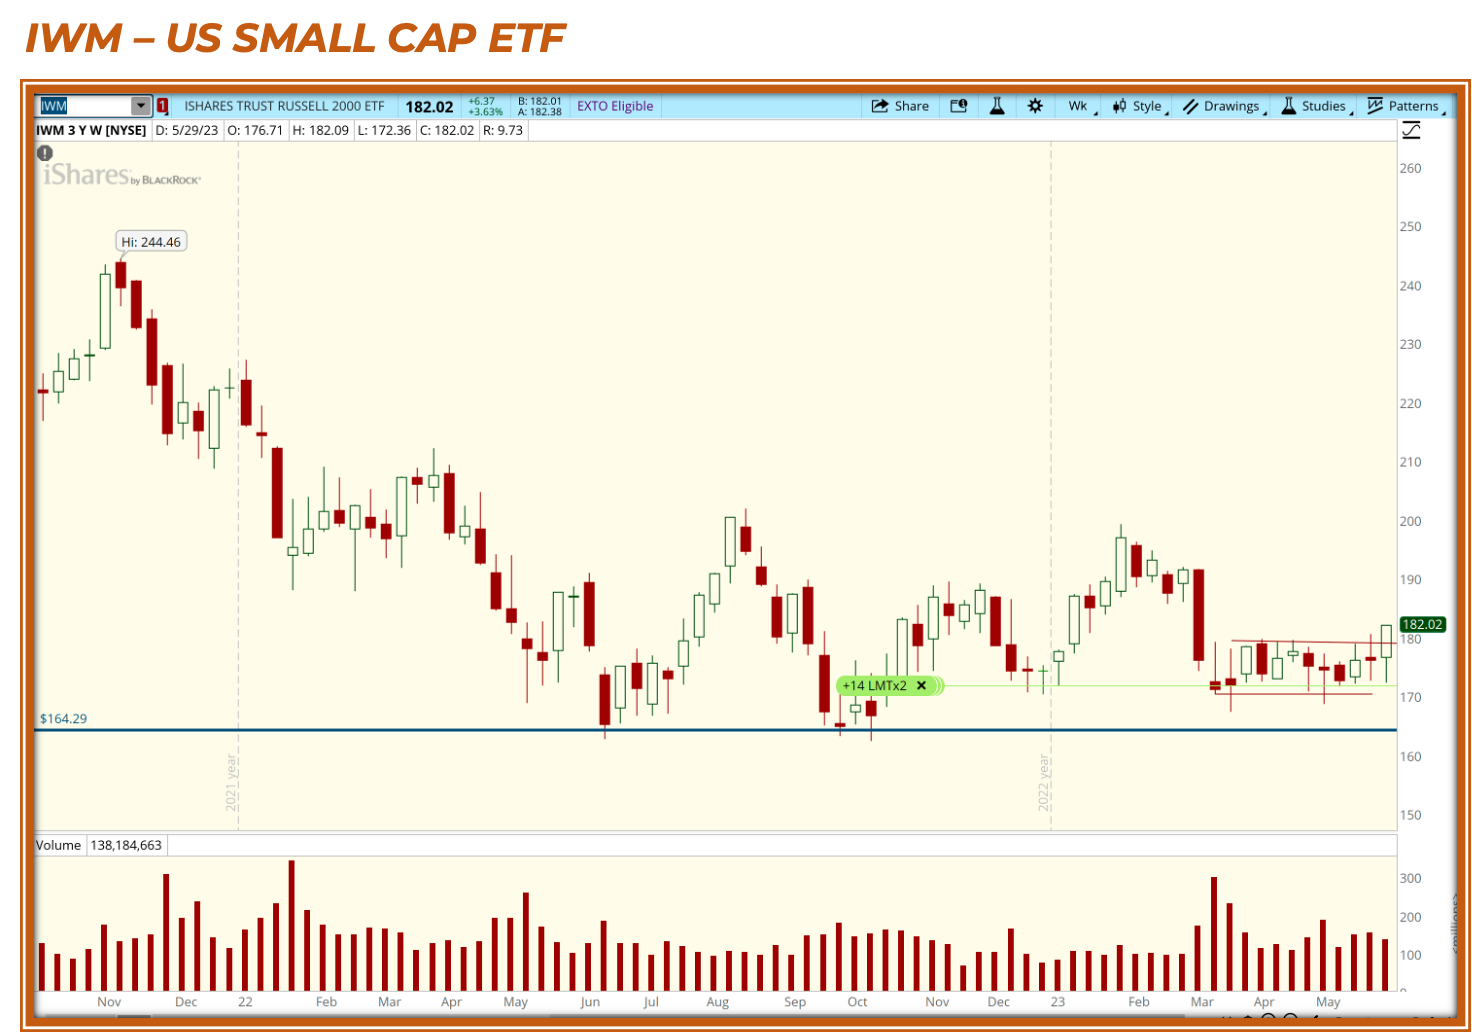
Earlier this week, we pointed out data that suggested that smaller and mid-cap stock ETFs were showing early signs of bullish momentum in their long-term and intermediate market forecast indicators. Well, the IWM finally broke out of a 2-month trading range. Will traders rotate to small caps, or will the market continue to be a one-trick large-cap tech pony?
We can use Relative Strength analysis to divine likely market direction. This is the toolset that gives us the ability to “skate where the puck is going to be”, in the immortal words of hockey great, Wayne Gretzky.
Cheat Sheets’ Relative Strength Rank and Trend Report - Watchlist Builder
For an optimal user experience, click to enlarge each stack and view it on a computer.
Key Relative Strength Rank & Trend Report Watchlist Criteria
Watchlist Grade A - The ETF must maintain an average relative strength rank that keeps it in the top 50% of all ETFs in the stack throughout the Sweet Spot look-back period of 60 to 120 trading days.
The ETF must maintain an average RS rank that puts it in the top 30% of all instruments compared over the most recent 10-day to 60-day look-back period.
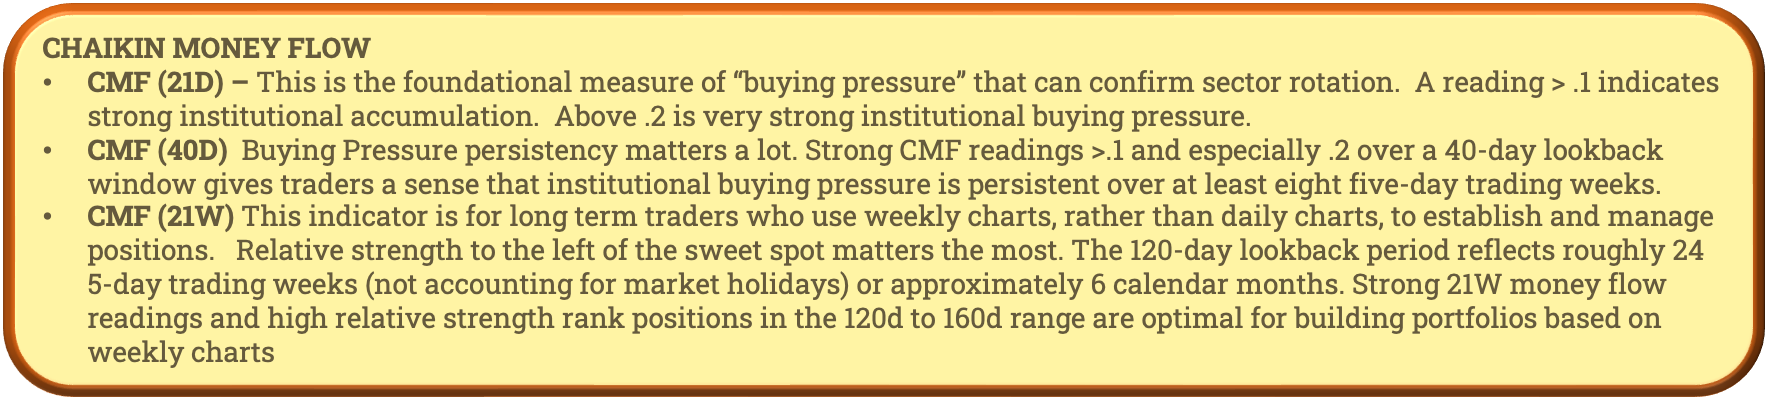
Money Flow must score above .2, which implies very bullish levels of institutional accumulation. We use the terms money flow and buying pressure interchangeably
Both (D) daily and (W) weekly trend postures must be “UP”. That occurs whenever an ETF’s 10-period exponential moving average is greater than its 40-period EMA’. In markets recovering from a prolonged downtrend, weekly (W) trend postures can take months to recover. Some traders will discount that timeframe, while others will stay out of any market until the 10 (W) EMA crosses above the 40 (W) EMA.
Watchlist Grade ‘B+ ‘ - Candidates are subject to similar, but slightly looser criteria. The money flow minimum is dropped to a bullish rating of .1 or better, and either the weekly OR the daily trend posture must be UP (as opposed to requiring both timeframes to signal “UP” trend postures). Finally, the top 30% average ranking for the 10 to 60-day look back period is dropped. Only the 50% average rank rule for the SweetSpot look back period remains in place.
We’re still identifying a very strong Watchlist Candidate with a B+ rating. See the User Guide for a deeper discussion of Relative Strength Rank and Trend Reports.
Global Stock Market Relative Strength Rank and Trend
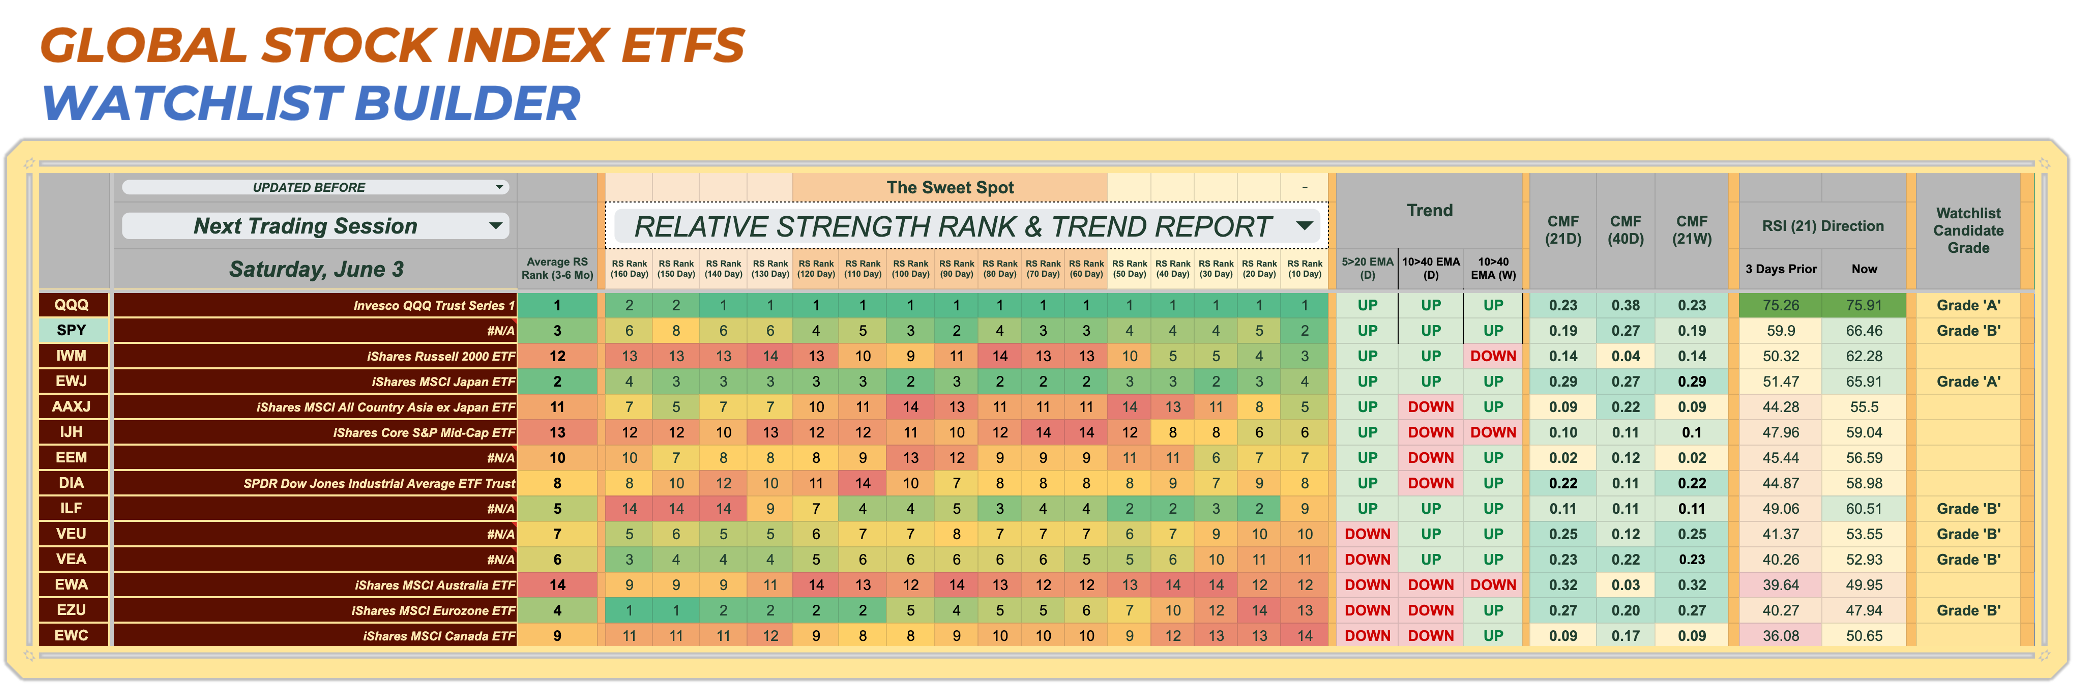
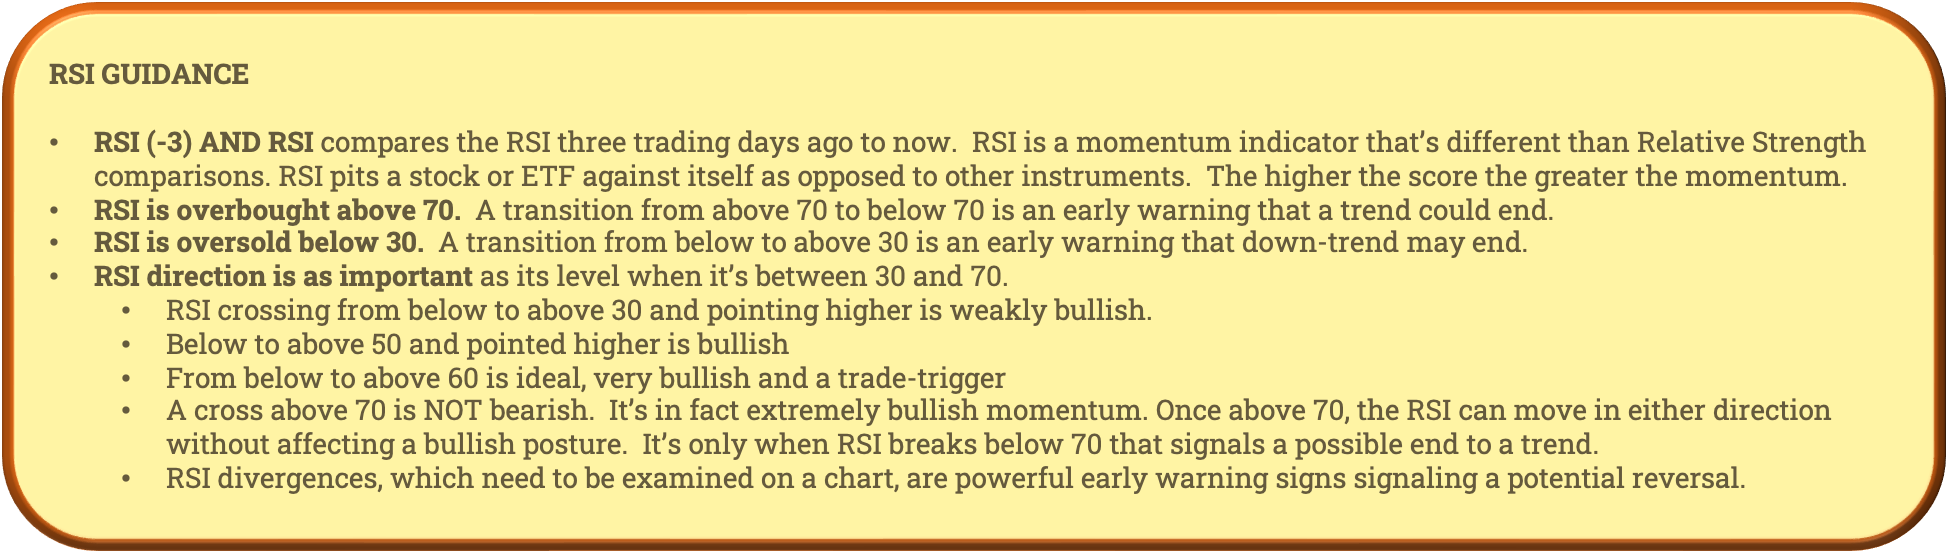
The IWM’s price performance is growing stronger relative to global stocks, but its rank advancement falls just shy of impacting the critical 60 to 120 trading day Sweet Spot look back period. However, other metrics bode well. The small-cap index ETF’s short-term and intermediate trends are UP. CMF (21D) is now bullish and the RSI transitioned optimally to above 60 over the past three trading days. I nibbled on IWM shares Friday but didn’t take a full bite. Breakouts often lead to pullbacks and the opportunity to buy the next tranche a little cheaper.
The Eurozone (EZU) is undergoing a relative strength pullback, but it holds its rank in the critical Sweet Spot. The weekly trend remains intact, Money flow is still extremely bullish, and the RSI is rolling up from Neutral (-) levels. This looks like an intermediate pullback — one potentially setting up for another leg higher.
The money flow numbers across global stocks are nearly universally bullish. Energy-dependent Canada and commodity-dependent and interest rate-sensitive emerging markets are a little weaker but by no means fully bearish.
Very Bullish Japan, EWJ, just enjoyed an RSI cross from neutral to bullish over the past three days. It and QQQ are the globe’s strongest index ETFs. So far, inflation in that country has not yet caused BOJ to start raising rates. That’s a potential risk for future stock market gains in the EWJ not to mention global bonds, which yield much higher than domestic Japanese fixed income.
Global-Macro Assets (Stocks, Fixed Income, Dollar and Commodities) Relative Strength Trend
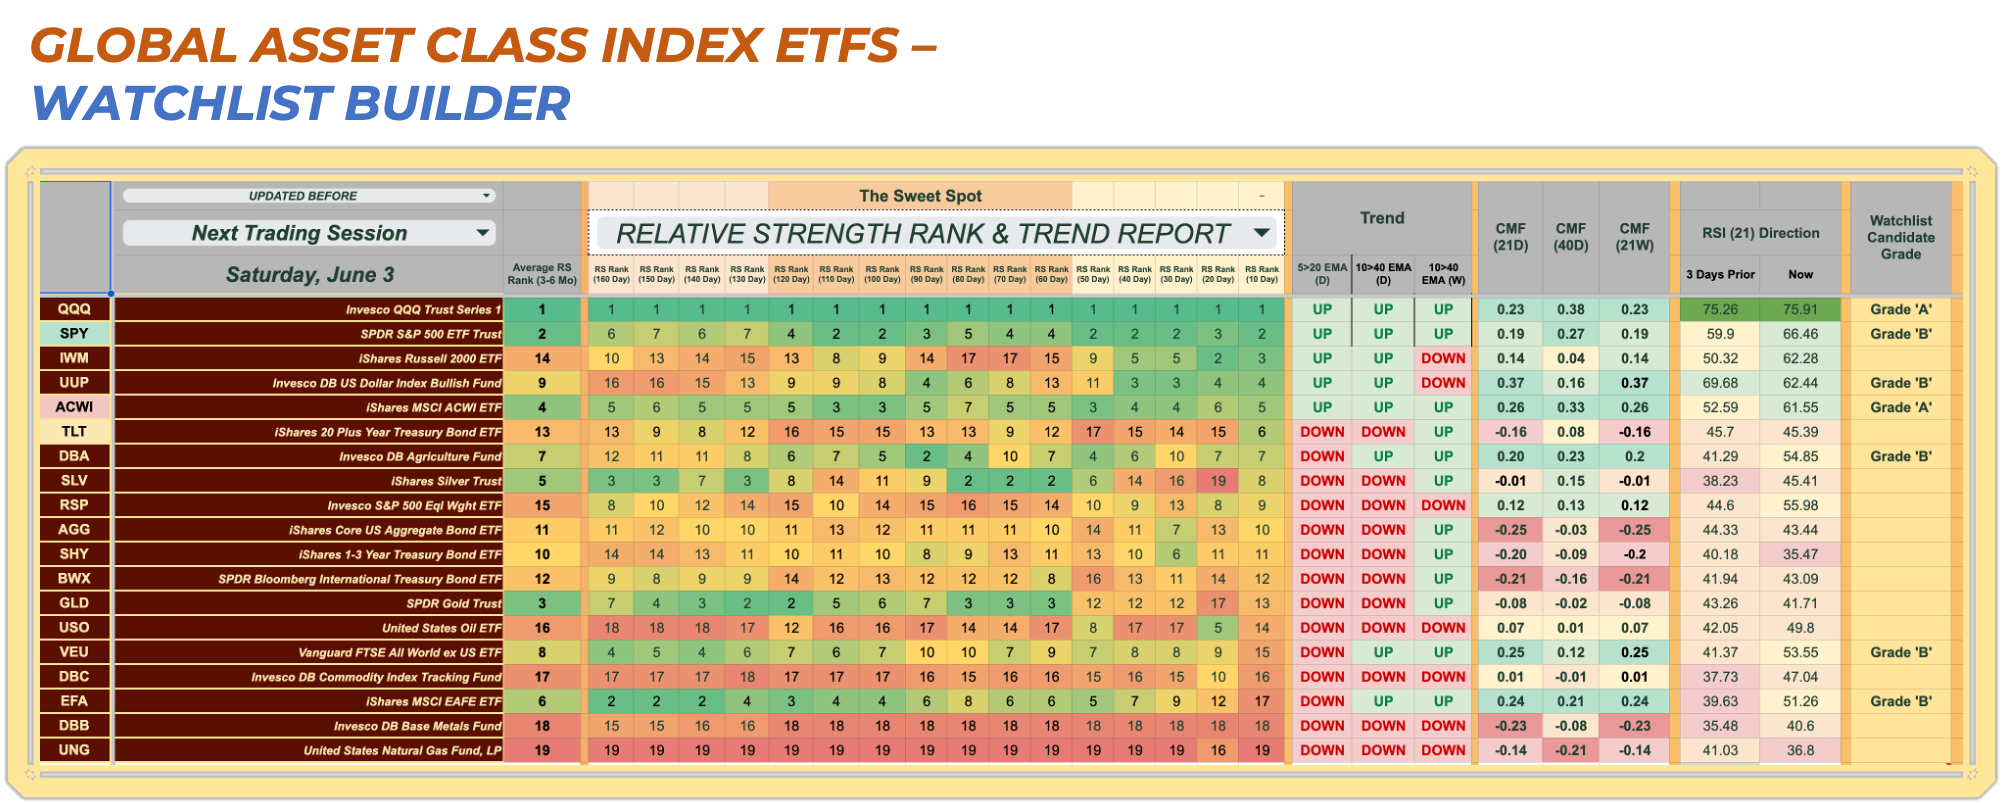
Any concerns about inflation should be limited to the strong jobs market, which puts upward pressure on wages and may cause the Fed to keep hiking. However, with the exception of agriculture, commodities look downright deflationary. Energy (UNG, USO), Industrial Metals (DBB) are bearish, and precious metals (GLD and SLV) are mixed at best. Agricultural commodities are the exception. Food is going to be a “thing’ this summer. Strong money flow, top 50% Relative Strength rank in the Sweet Spot and an upward moving RSI all point to bullish trends for DBA.
US Sectors
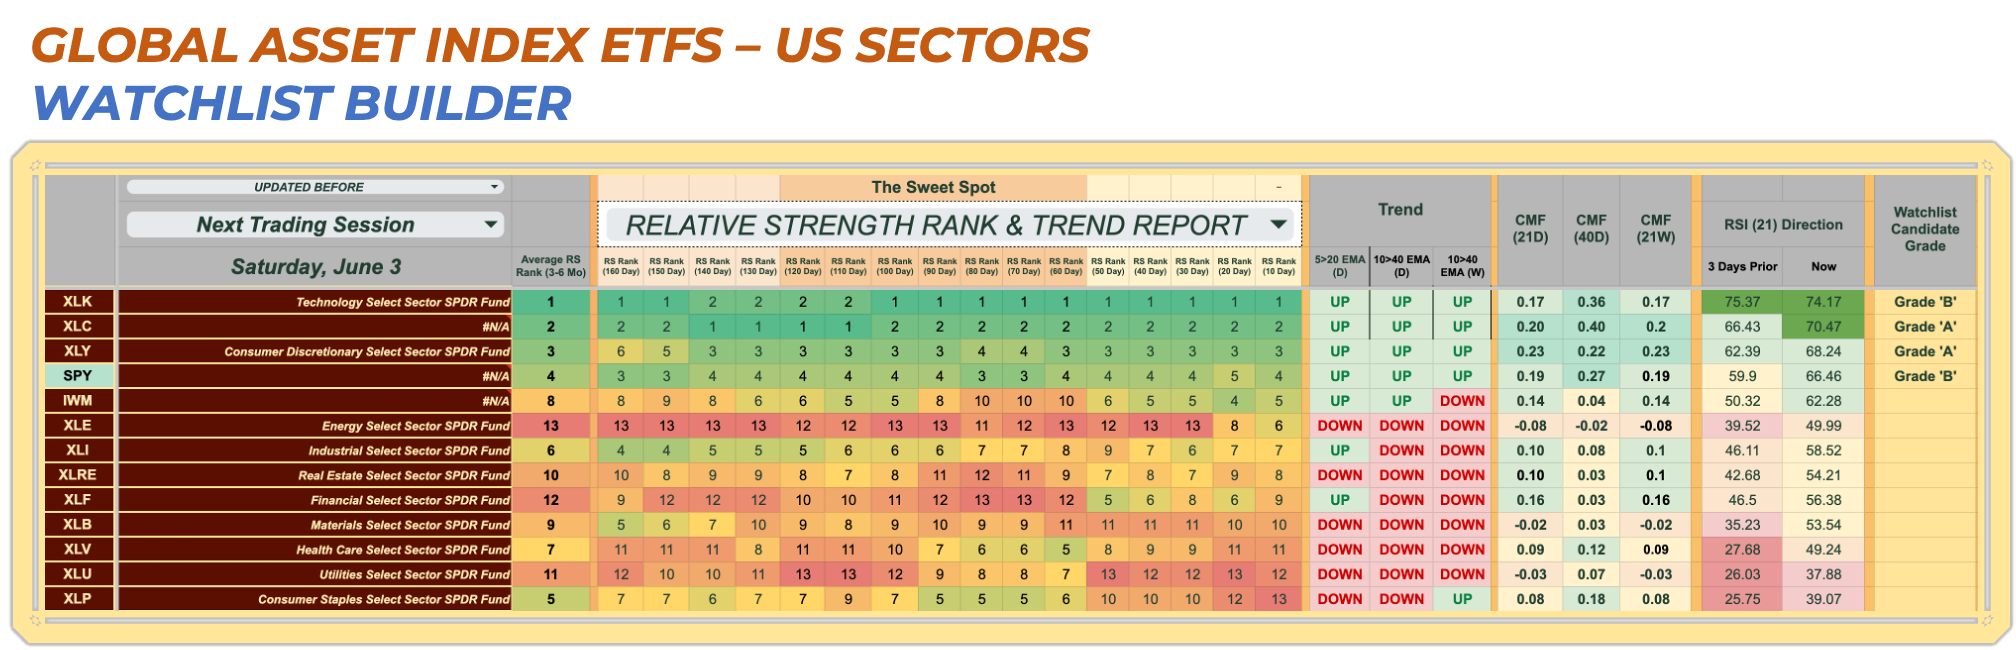
XLK’s money flow fell below .2 for the first time since forever, downgrading it to only a “B” watchlist candidate (still pretty strong). Perhaps we’ll get a small pullback/entry opportunity.
The most bearish parts of the US market include areas of the economy we consider “defensive”, such as XLP (staples), XLU (utilities), and XLV (healthcare). However, the bearish RS rotation has not yet made the Sweet Spot.
Financials (XLF), Real Estate (XLRE), and Industrials (XLI) show bullish money flow and some signs of RS rank improvement, but nothing impacting the more statistically significant Sweet Spot timeframe yet. If the market is going to rotate bullishly past discretionary and tech, this is where it will happen. We need to look at sub-sectors to see where the pockets of strength in these sectors might be.
Materials (XLB) and Energy (XLE) look quite weak overall.
US Sub-Sectors
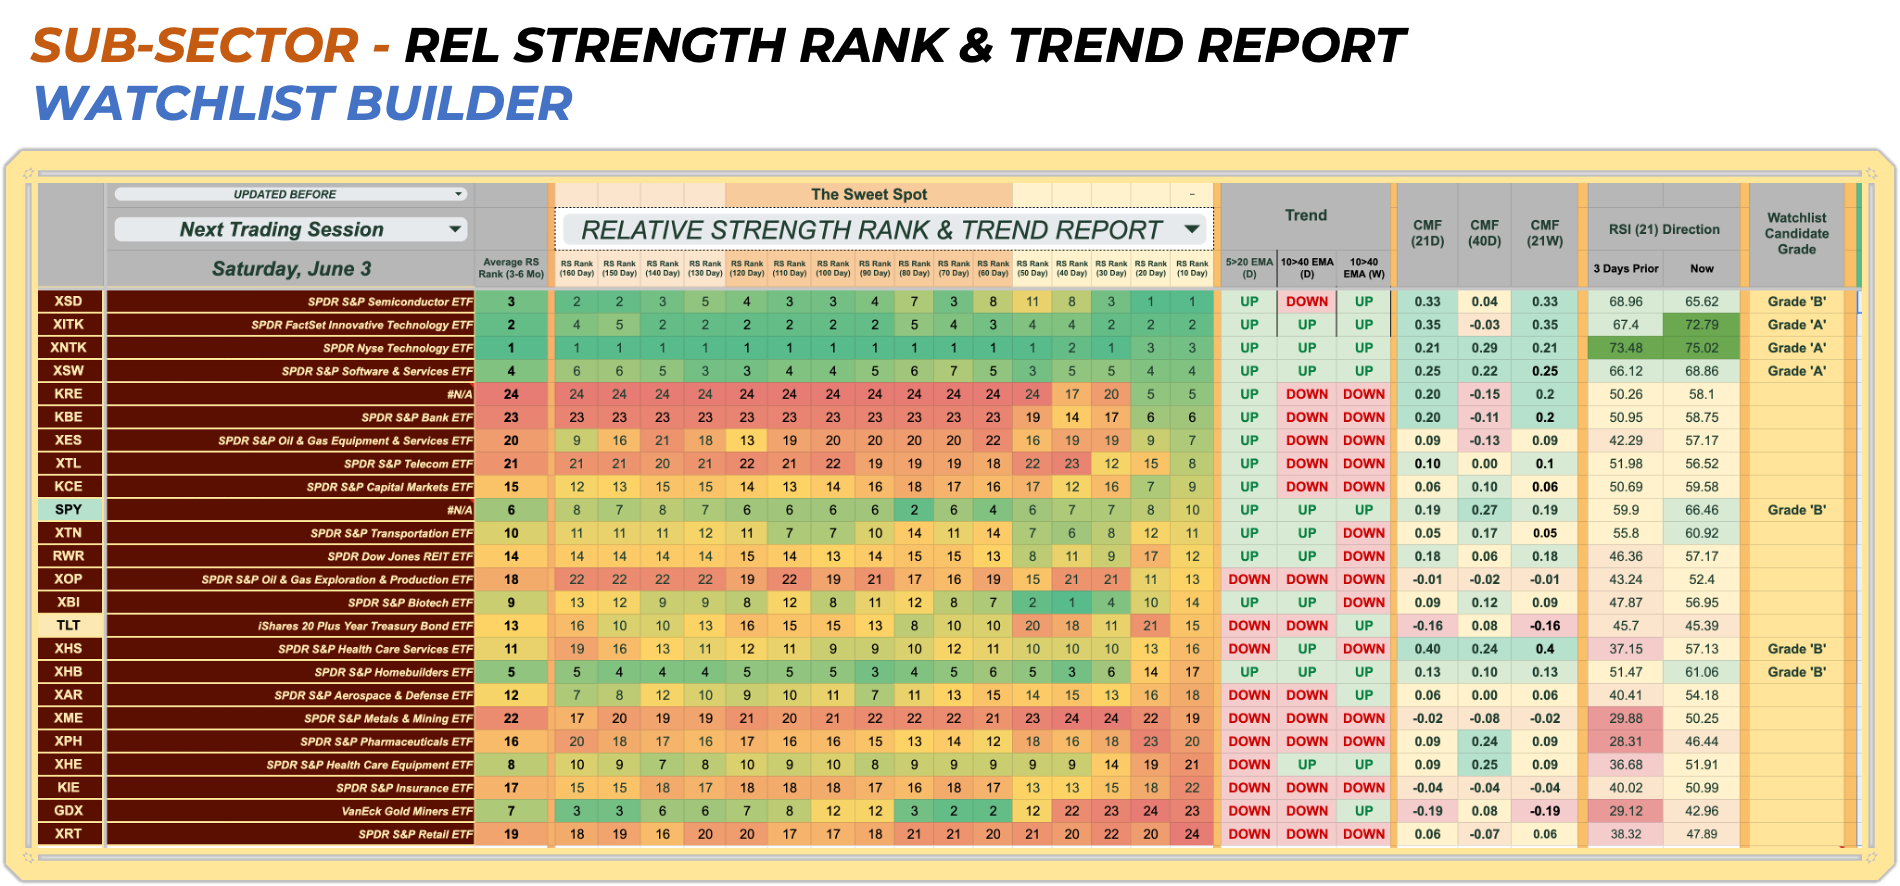
There are some signs that regional (KRE) and money center (KBE) banks are springing back to life. Relative Strength rotation is showing very preliminary signs of bullishness well outside the Sweet Spot, supported by Very Bullish money flow. That means institutions are bargain hunting zealously. RSI scores are Neutral + and moving higher. Capital Markets (KCE) aren’t quite as strong, but never plunged to extreme lows like the banks did either. Overall, Financials show promise for where the “puck” might travel next. But additional Fed hikes could trigger another banking collapse, so I choose to be a follower rather than a leader investing in this part of the market.
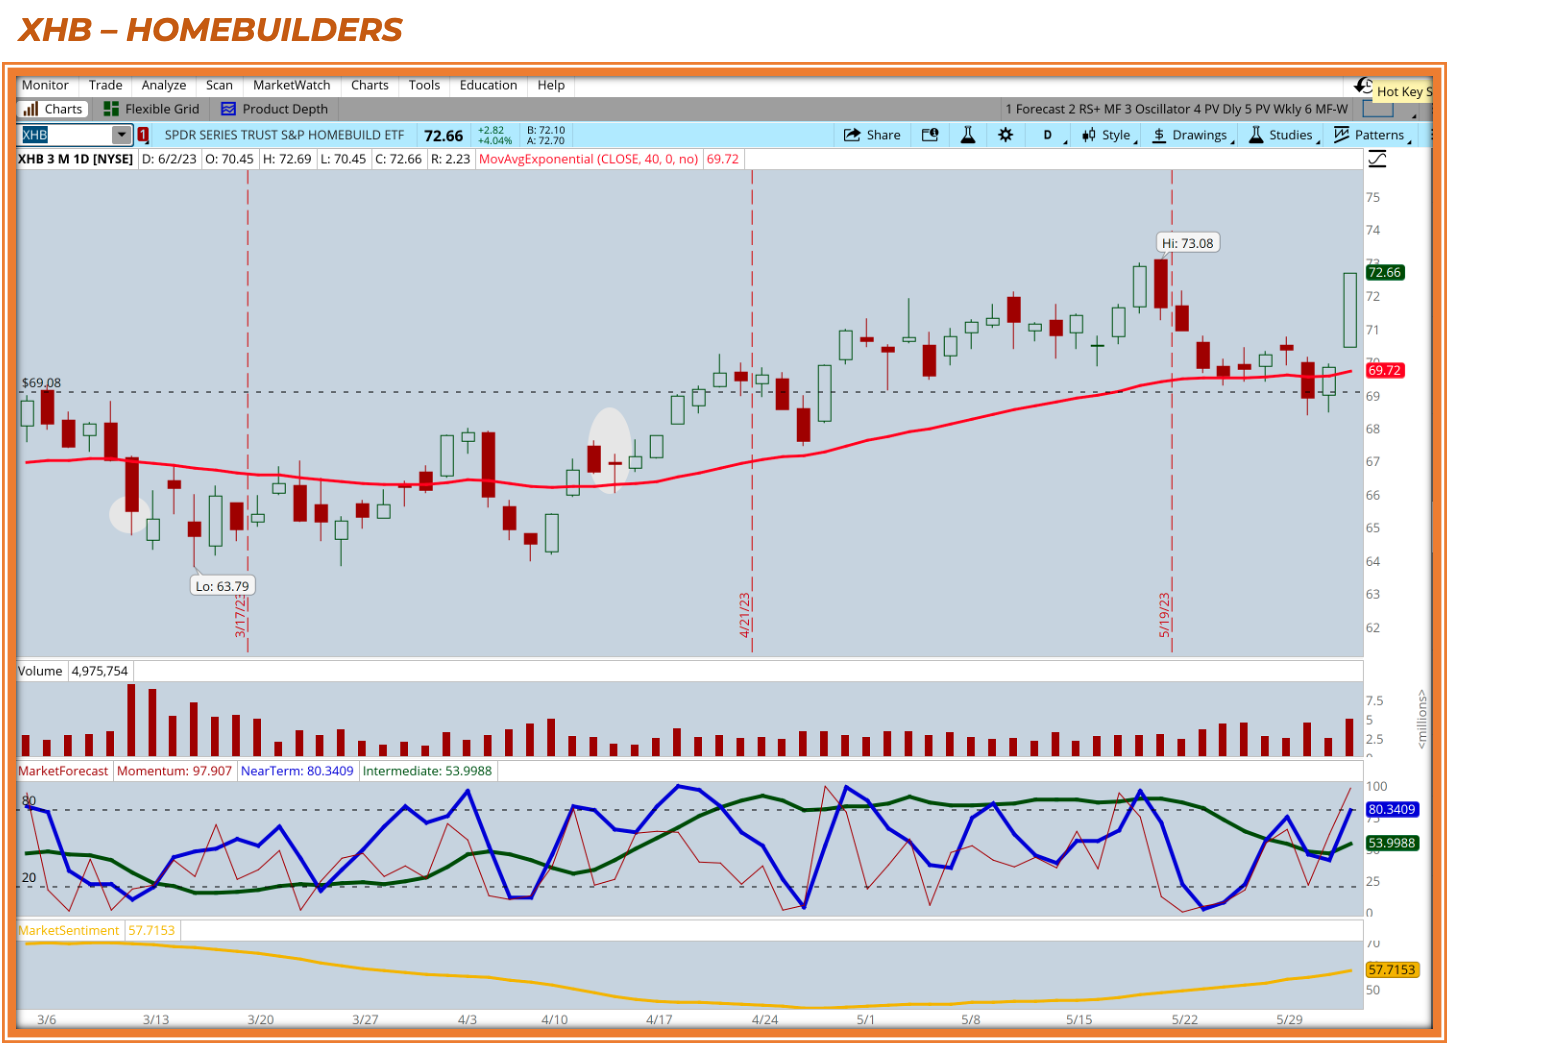
Residential REIT ETF (RWR) is showing similar mixed to bullish signs despite higher rates and the threat of additional increases (in late July after the Fed likely skips a meeting before resuming hikes). Homebuilders looks even better despite a short 10 to 20 day relative strength pullback.
Disclosure about Trading Risk
Take advantage of our free and premium email subscriptions. Get Cheat Sheet Trading Signals and Relative Strength Reports delivered via email each week. There is a 7-day Free Trial available for free-subscribers wishing to try Cheat Sheets Premium
Premium Cheat Sheets Premium Stacks
Let’s take a look at Quantimental Killer stocks for Homebuilders based on the analysis above. The ETF is showing a very strong Market Forecast profile. Despite the recent RS pullback, we may be getting a bounce opportunity now. Since I’ve overloaded you with tech picks the last few weeks, this list will be about what COULD be the next for stocks that are part of the XHB.