

The AI Supercycle Has a Zip Code. Our Data Has the Delivery Address for the $725 Billion Flowing Into Tech.
Innovative & Disruptive Tech ETF Relative Strength Rank and Trend Report – May 5, 2026: Where Institutional Money Is Biting Hardest Inside the Innovation Stack

Innovative & Disruptive Tech Relative Strength & Trend Report
Based on Tuesday, May 5, 2026 Close
Not all tech is created equal right now. And the institutions know exactly which kind they want.
QQQ just posted its best monthly gain since 2002, surging 15.4% in April and closing at an all-time high of $674 on May 1st. Year-to-date, the Nasdaq-100 is up nearly 39%. Tech sector earnings are now projected to grow 38% in 2026 and another 25% in 2027 — a revision that has been moving up, not down, with each passing earnings cycle. That is not noise. That is a structural re-rating of the innovation complex in real time.
But here’s the part that separates smart positioning from dumb chasing: the institutions are not buying all of tech. They are being surgical.
The reason is written right into the capex data. The five major hyperscalers — Microsoft, Alphabet, Amazon, Meta, and Oracle — have now collectively guided $600–$725 billion in 2026 AI capital expenditure, with roughly 75% of that spend earmarked for AI infrastructure. Meta alone raised its 2026 capex ceiling to $145 billion. Microsoft projected $190 billion — up 61% from 2025. Goldman Sachs models suggest AI capex hits $765 billion this year and nearly doubles to $1.6 trillion by 2031. That is not a trend. That is a supercycle with a very loud engine.
The first dollar of every one of those budgets goes to silicon. And NVIDIA just reclaimed a $5 trillion market cap as AI chip demand continues to surge, with earnings projected to grow 69% this year. TSMC is targeting a 30%+ revenue surge in 2026 and has committed that capex over the next three years will be “significantly higher than the past three years”. The semiconductor complex is not participating in the AI trade — it is the AI trade.
But the broadening is real, and it is where the most interesting institutional behavior is happening right now. Autonomous vehicle funding just hit its highest level in more than a decade, with Waymo alone raising $16 billion in February. Wood Mackenzie calls 2026 a clear “inflection point” for autonomous and electric vehicles — the transition from isolated pilots to commercial-scale deployment. Quantum computing is moving from theoretical to investable, with IBM’s Quantum Nighthawk processor and real-world use cases beginning to surface across enterprise deployments. The Defiance ETFs CEO called quantum computing’s 2026 emergence as the moment “the investing public is now witnessing real-world use cases” — not lab demos.
The question is no longer whether the tech trade is real. The question is where inside the innovation stack the institutional money is biting hardest — and where it’s quietly walking away.
That is exactly what the Innovative & Disruptive Tech Relative Strength & Trend Report answers. Our framework cross-references Chaikin Money Flow across three time windows (short, intermediate, and long-term), trend structure across three trend frames, and relative strength rankings to identify the ETFs where accumulation is persistent — not just a one-day headline bounce.
The results are clear, and they are not flattering to every theme wearing a tech hoodie.
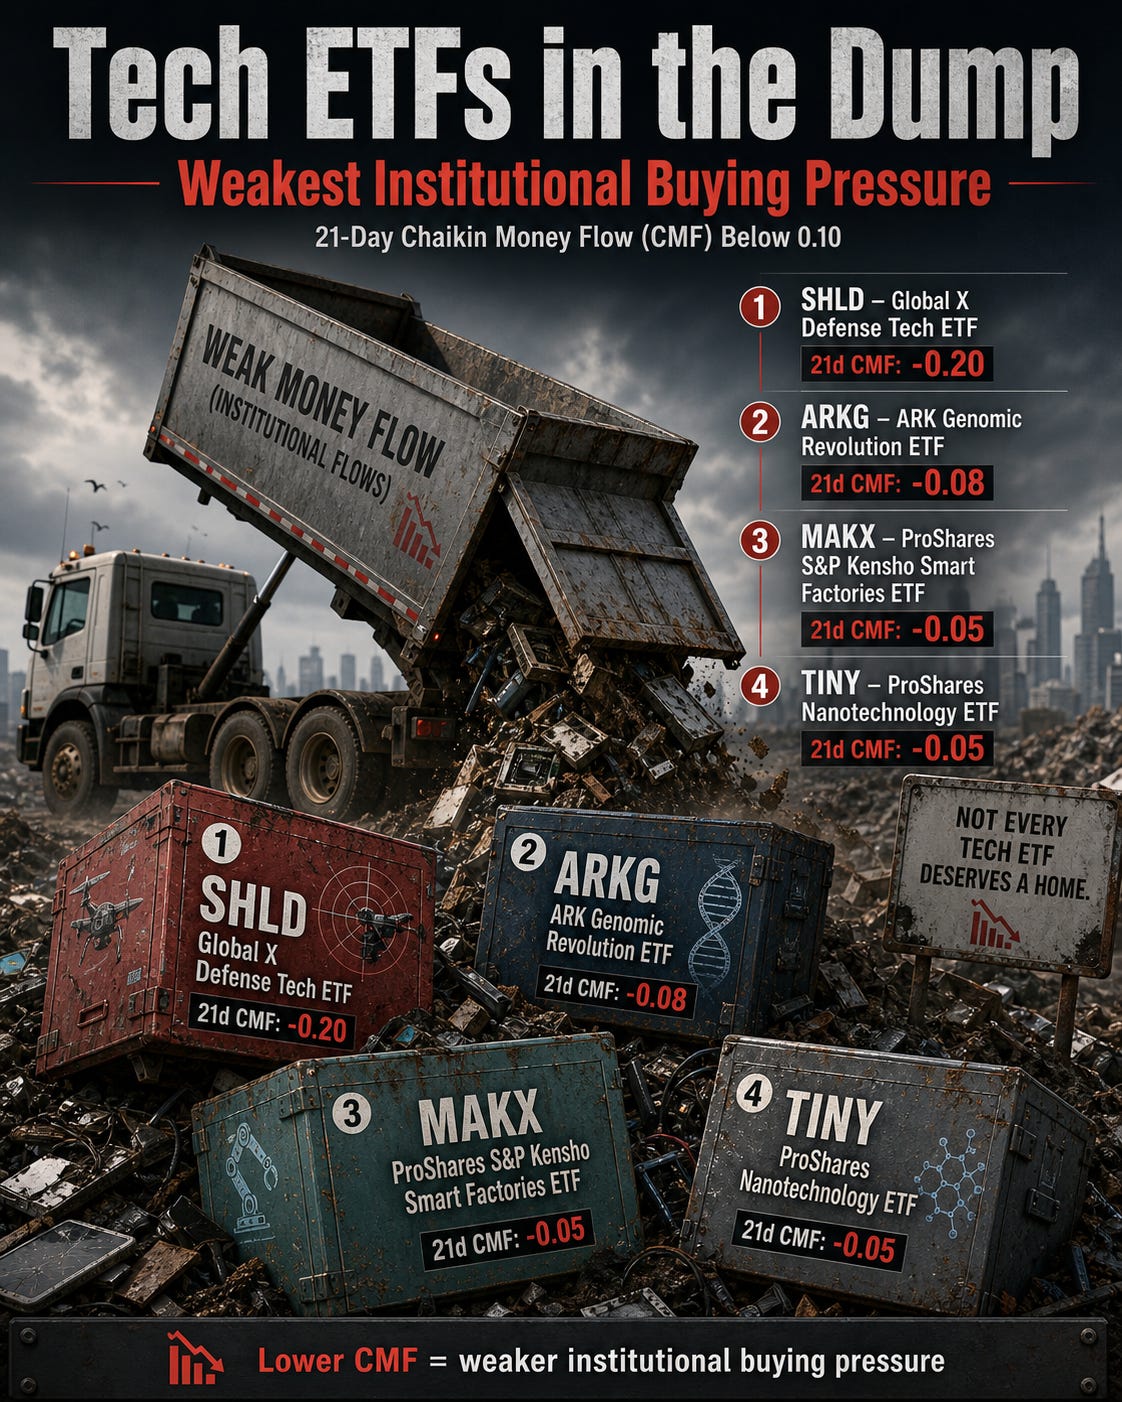
Some of the most talked-about names in the disruptive tech space — cybersecurity, cloud, software, fintech, genomics, social media, and defense tech — are showing mixed or outright distribution signals. Meanwhile, a tighter cluster of ETFs is demonstrating exactly the kind of multi-timeframe institutional accumulation that tends to precede sustained leadership.
The five names where the data says institutions are biting hardest, the two large-cap vehicles that confirm the broader bid, and the specific ETFs where money flow is quietly reversing direction — that full breakdown is ahead for Premium subscribers.
Click to enlarge data tables. They are best viewed on computer or tablet. If you’re viewing on a mobile device, a ticker by ticker analysis follows the report below.
