

Top-Down Analysis for Friday May 19th

Good morning investors and traders. Thank you for subscribing to StockCheatSheets.com. This morning, stock futures are up, VIX futures are down, and the 2-year treasury yield has given back a couple of basis points. Are these truly signs — according to the financial media — that major market participants are calm and reassured by happy talk despite an oncoming storm of potential financial chaos Or is there another explanation for stocks defying gravity?
I wanted to make you aware of one trading signal on the small cap US stock ETF IWM. The intermediate trend progression signal is one of Cheat Sheet’s more powerful entries, especially a stage 2 with a rare “strong trigger”. In my opinion, a stage 2 ITP signal is Cheat Sheet’s most powerful entry, when market conditions support it. I’ve decided to post an explanatory video f so you don’t miss it, even though its appearing out of context. Especially consider my rant that follows this chart.
I’ve offered Cheat Sheets as a way for us less-well-connected, smaller traders to remain tethered to truth-in-data rather than held hostage by emotions spurred on by talking heads on TV talking their book, elected leaders attempting to manipulate the electorate, and click-baiters placing native digital ads meant to look like Op-Eds, with provocative titles that follow a familiar template “Move Your Money Now (And Buy Some Shit from Me) Before It’s Too Late"
See. Pretty opportunistic. But I’m not nearly dystopian click baitey enough.
I must admit that I’m struggling against my my own incendiary conflagration of emotions at the moment, which burn unhelpfully white hot and in sharp contrast to the market’s sanguine walk on the beach in flip flops this week — ear buds dialed into “Don’t Worry, Be Happy…Cuz Every Little Thing….”. After-all, we cooly strode.up and through a potential break-out of a months-long trading range this week. That’s a really big deal if it holds.
Perhaps I’m brainwashed, sucked into the spin cycle of acerbic Washington DC -brand cacophonous discord over the debt ceiling or I’m simply listening too intently to many hawkish Fed remarks make this week about being nowhere close to an inflation-target pipe dream target of 2%. (You don’t re-shore the industrial production of 21-trillion dollar economy without some inflation folks, especially when your country is on the verge of stiffing bond holders and, thus, permanently sending the interest owed on future borrowed capital skyward).
My emotions are overwhelming my analytical brain because I have become convinced that we ave successfully elected a large enough group of truly stupid people to make economic self-immolation no longer simply possible, but rather a probable outcome.
So, I need today’s data-driven top-down look at US stocks more than most of our truly level-headed subscribers.
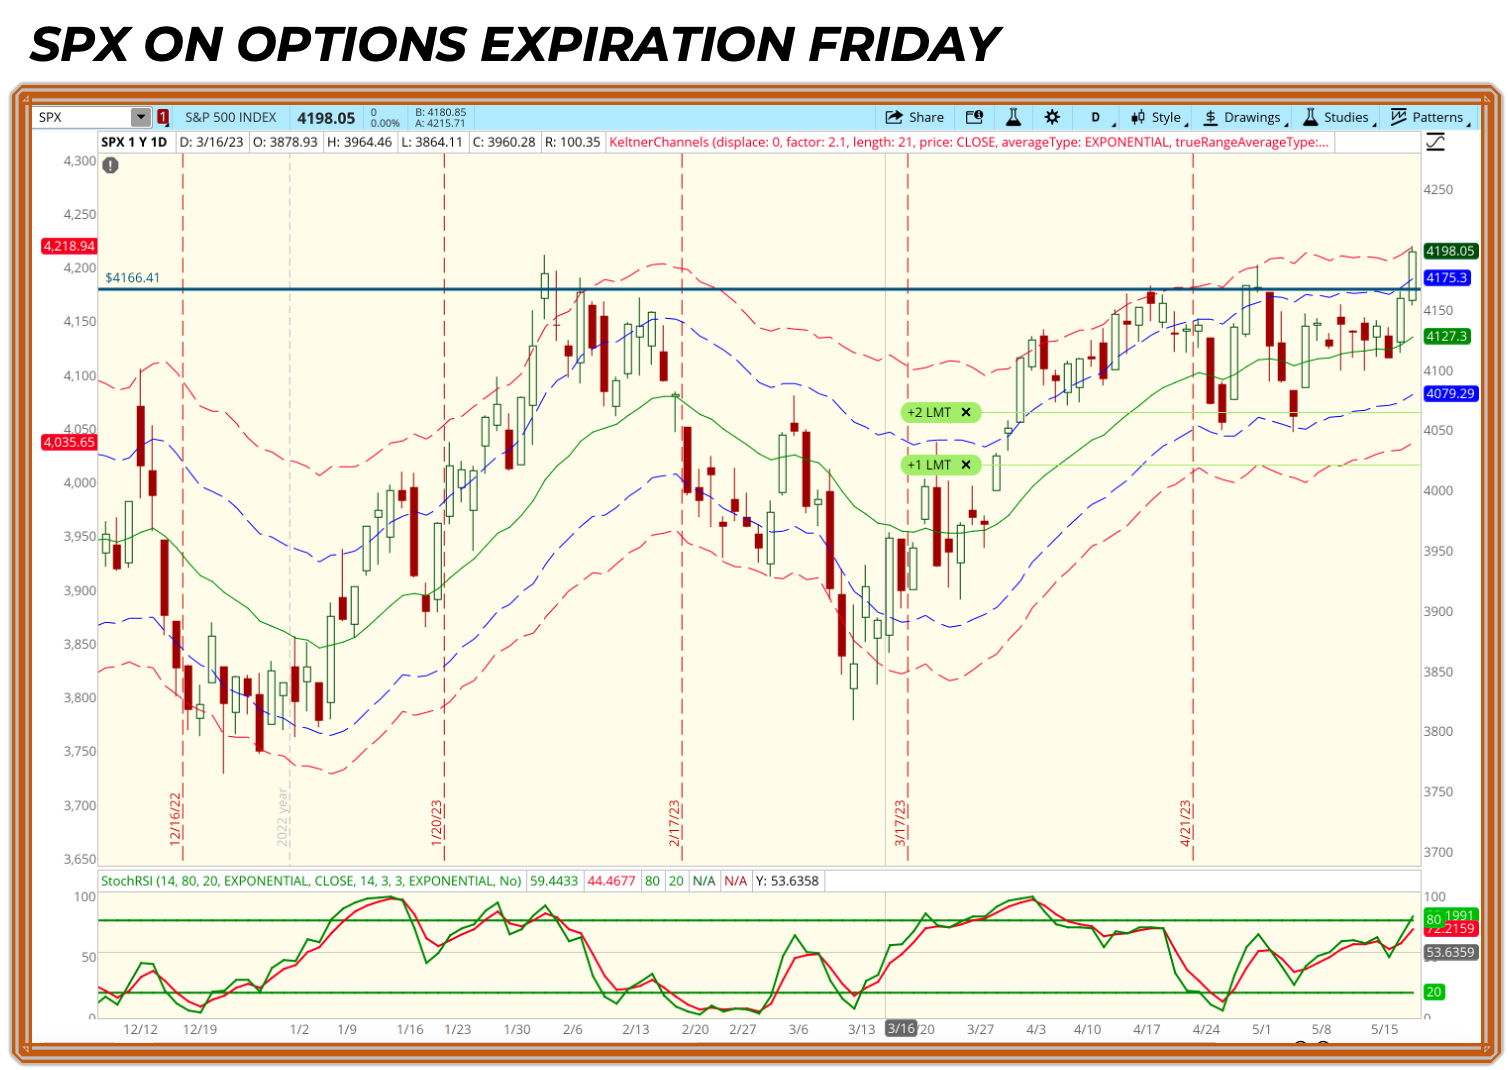
This is options expiration Friday. There’s a theory that market makers have a large incentive to keep a stock near a certain price at the time of an option’s expiration, and contracts with large open interest, such as the SPX index, can stay in a tight trading range around that “pinned” strike through expiration. The theory stems from the idea that many market makers and institutional traders are short the options that retail investors and traders are long. So these options short sellers have a strong incentive to keep or “pin” the underlying stock near a particular strike price.
On the chart above , a return to 4175 on the SPX could become a pinned reality. That would also look like a failed breakout at the close today, and we all know in which direction markets reward or punish traders for jumping on failed breakouts pre-maturely.
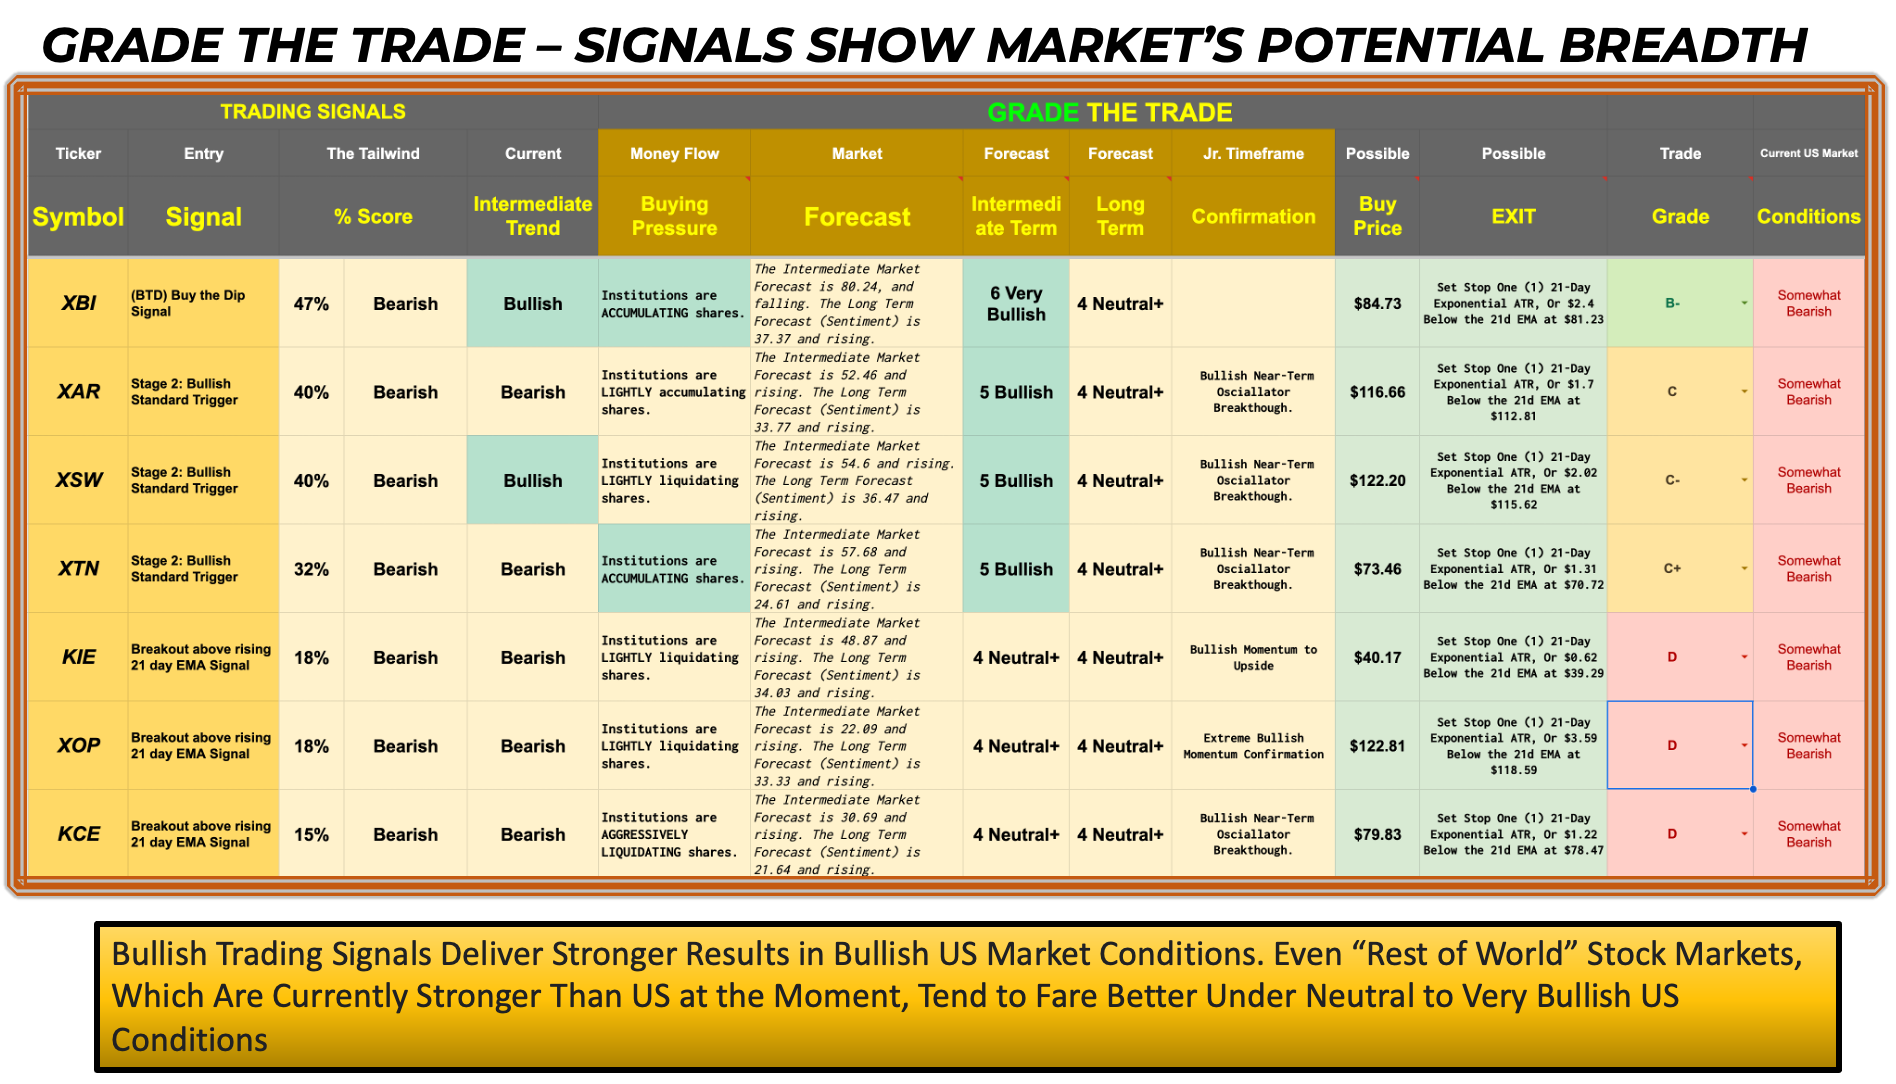
I’d further argue that the Cheat Sheet data below, which accurately summarizes the current technical picture, has remained ever-so-slightly bearish despite this week’s impressive market action, because what’s bullish is still rather narrow in the scheme of things. If large cap tech gets faded, into the close, there’s not a lot of other catalysts to save this breakout.
For best viewing, click to enlarge each stack and view on a computer.
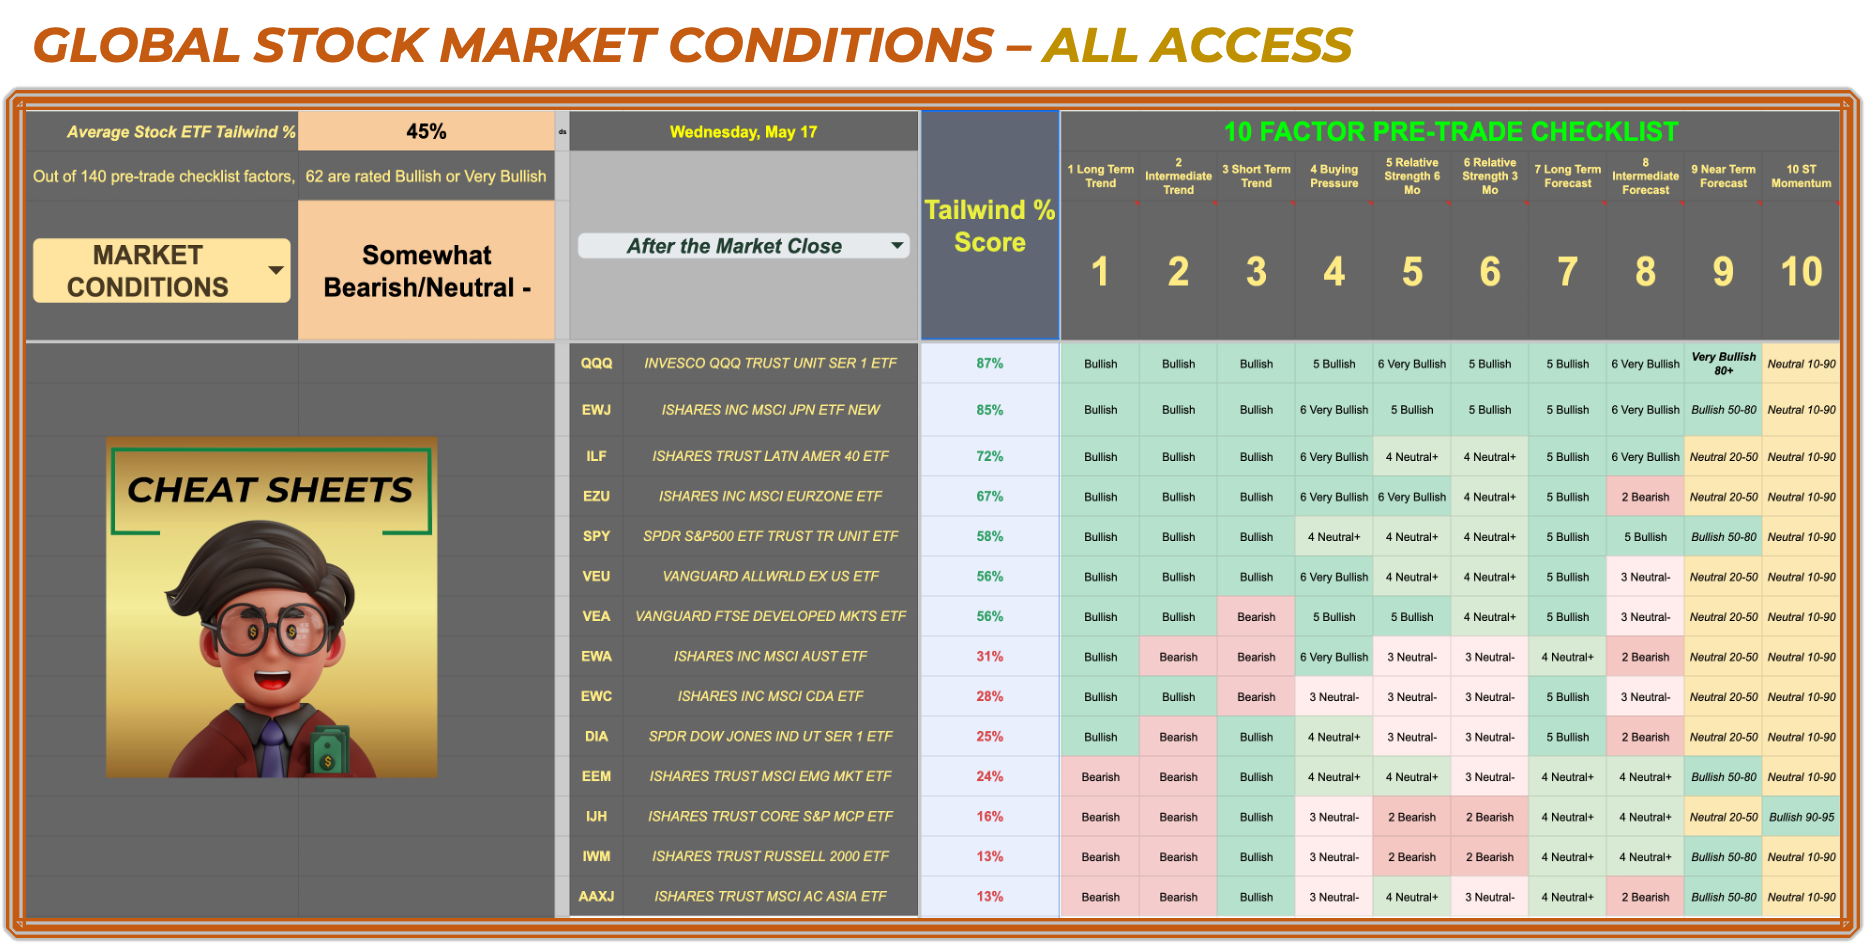
Global Equity ETFs - Yesterday’s Rating (Review)
These are yesterday’s pre-market metrics just for comparison purposes. Overall TW% puts us as Neutral -
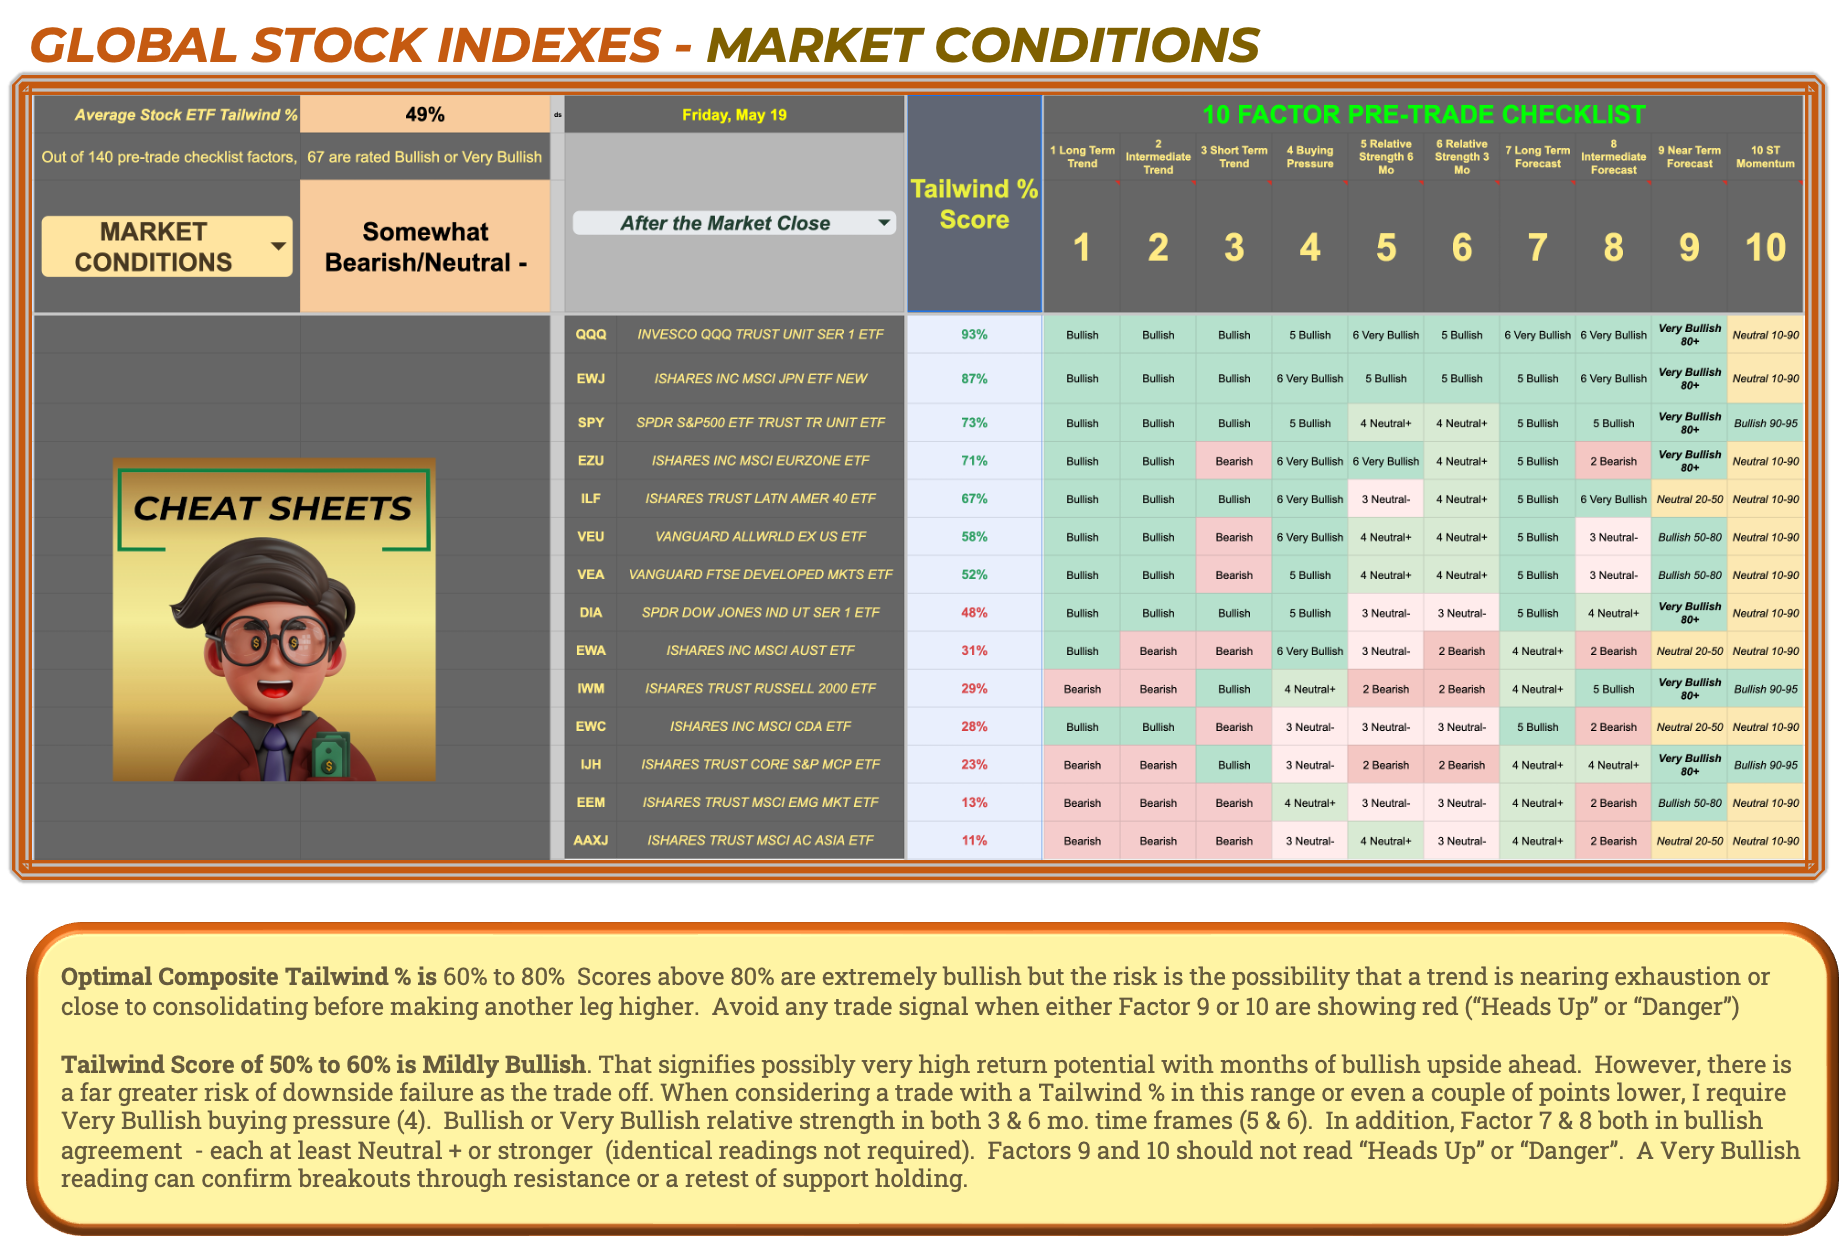
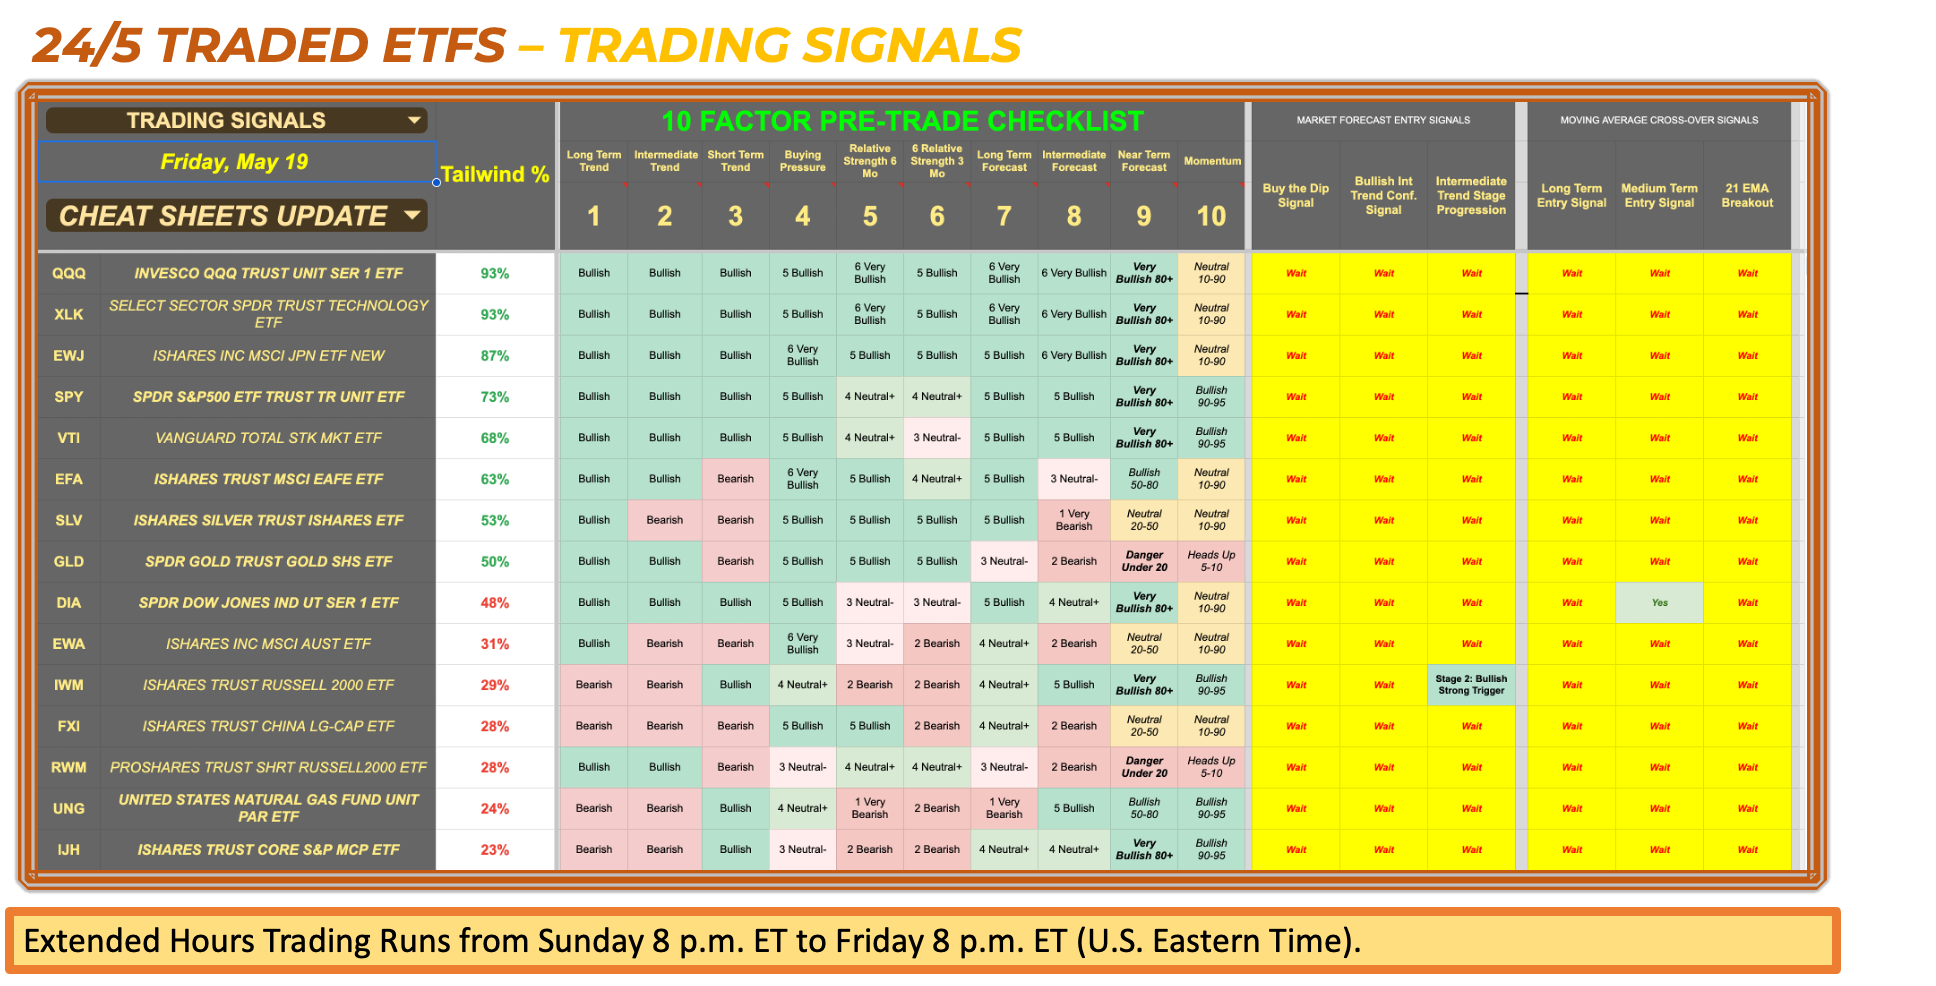
Today’s Global Equity ETF Market Conditions
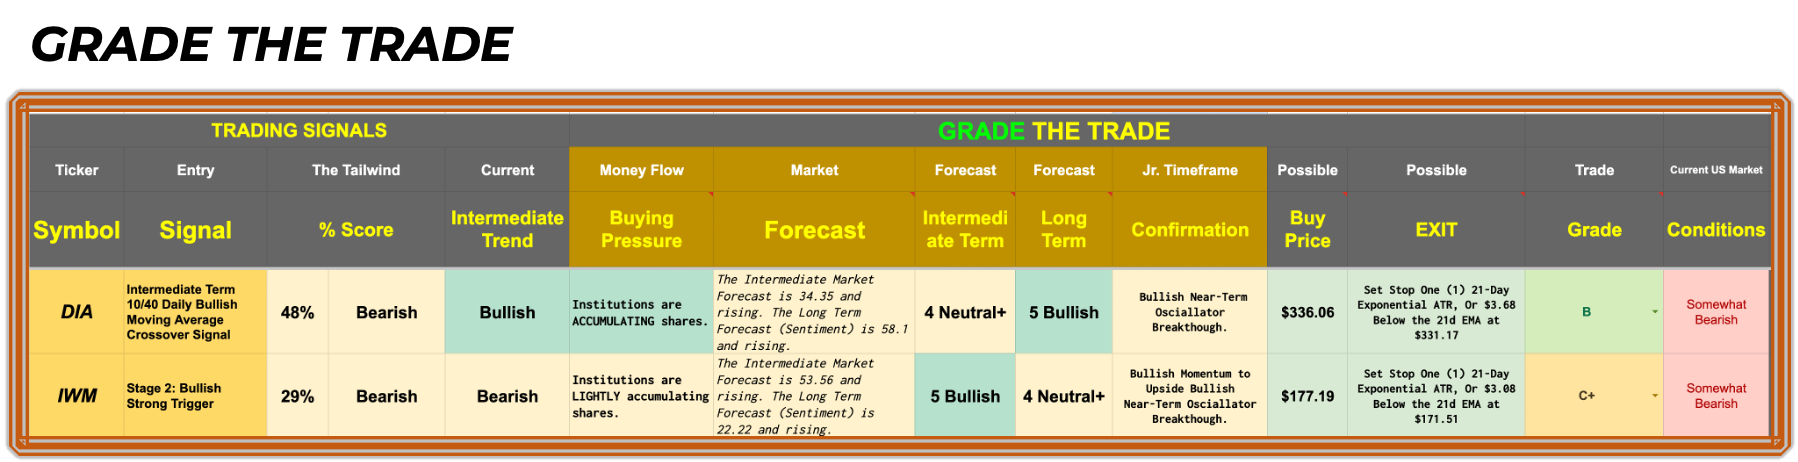
The IWM’s improved money flow, and all four market forecast oscillators now in bullish agreement (not all the same reading but no bearish forecasts in any timeframe) is a significant positive sign for US stocks. DIA’s TW% is approaching 50. The data suggests that some of yesterday’s move reflects committed buying on the part of institutions.
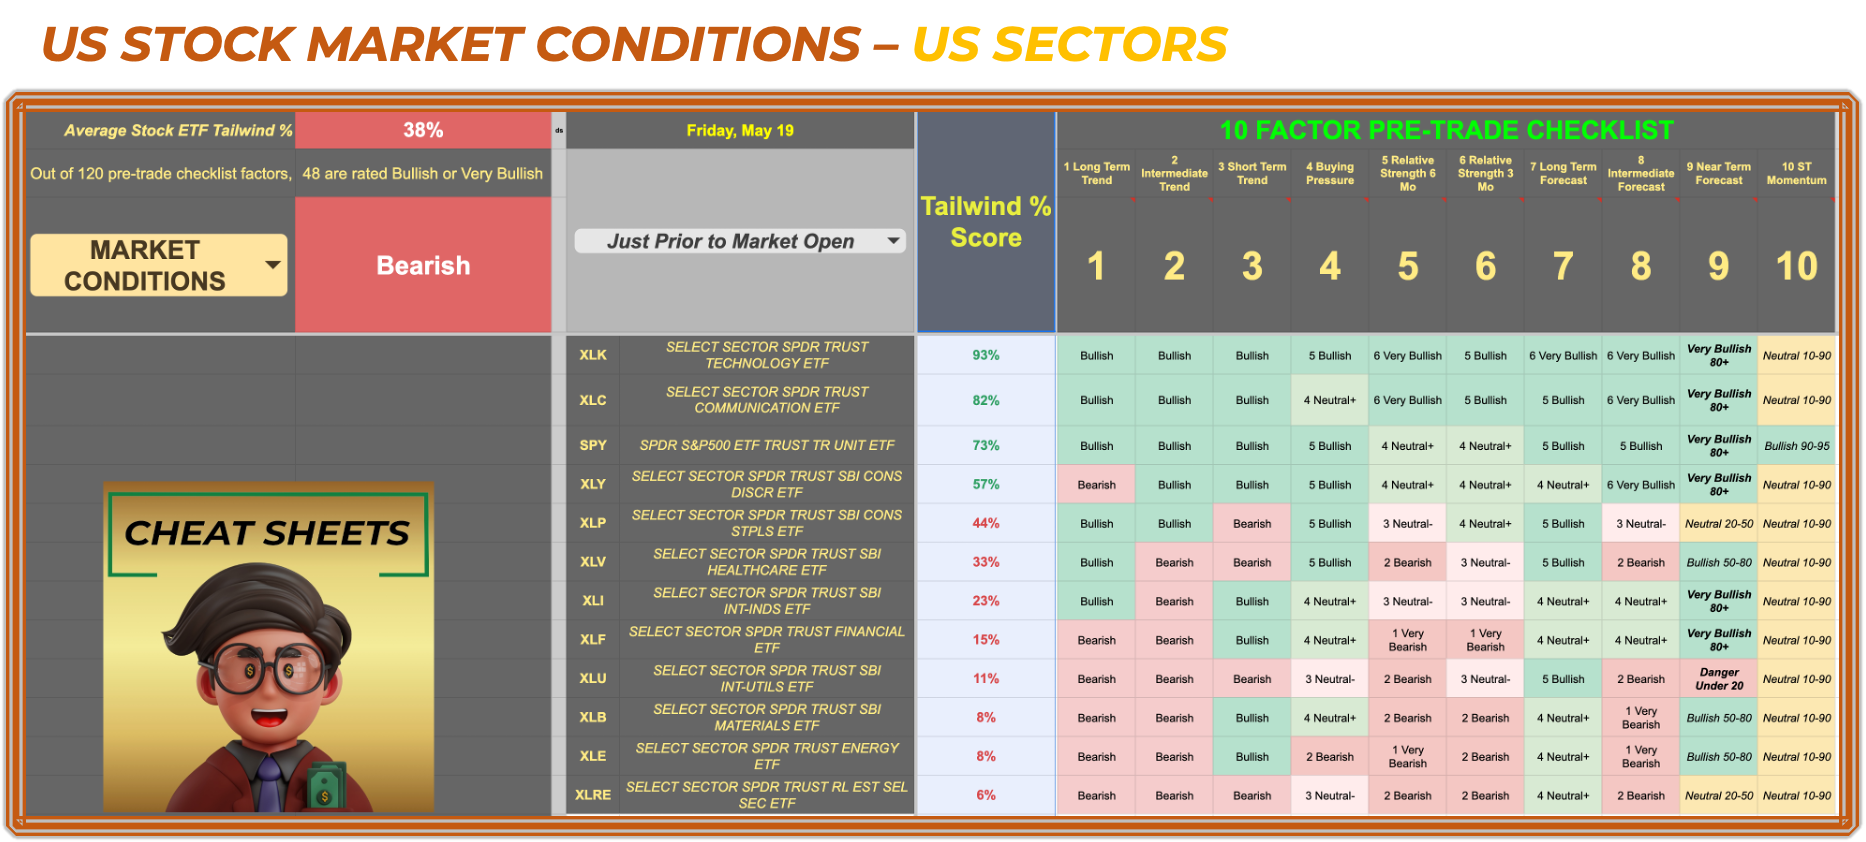
US Stock Index ETFs
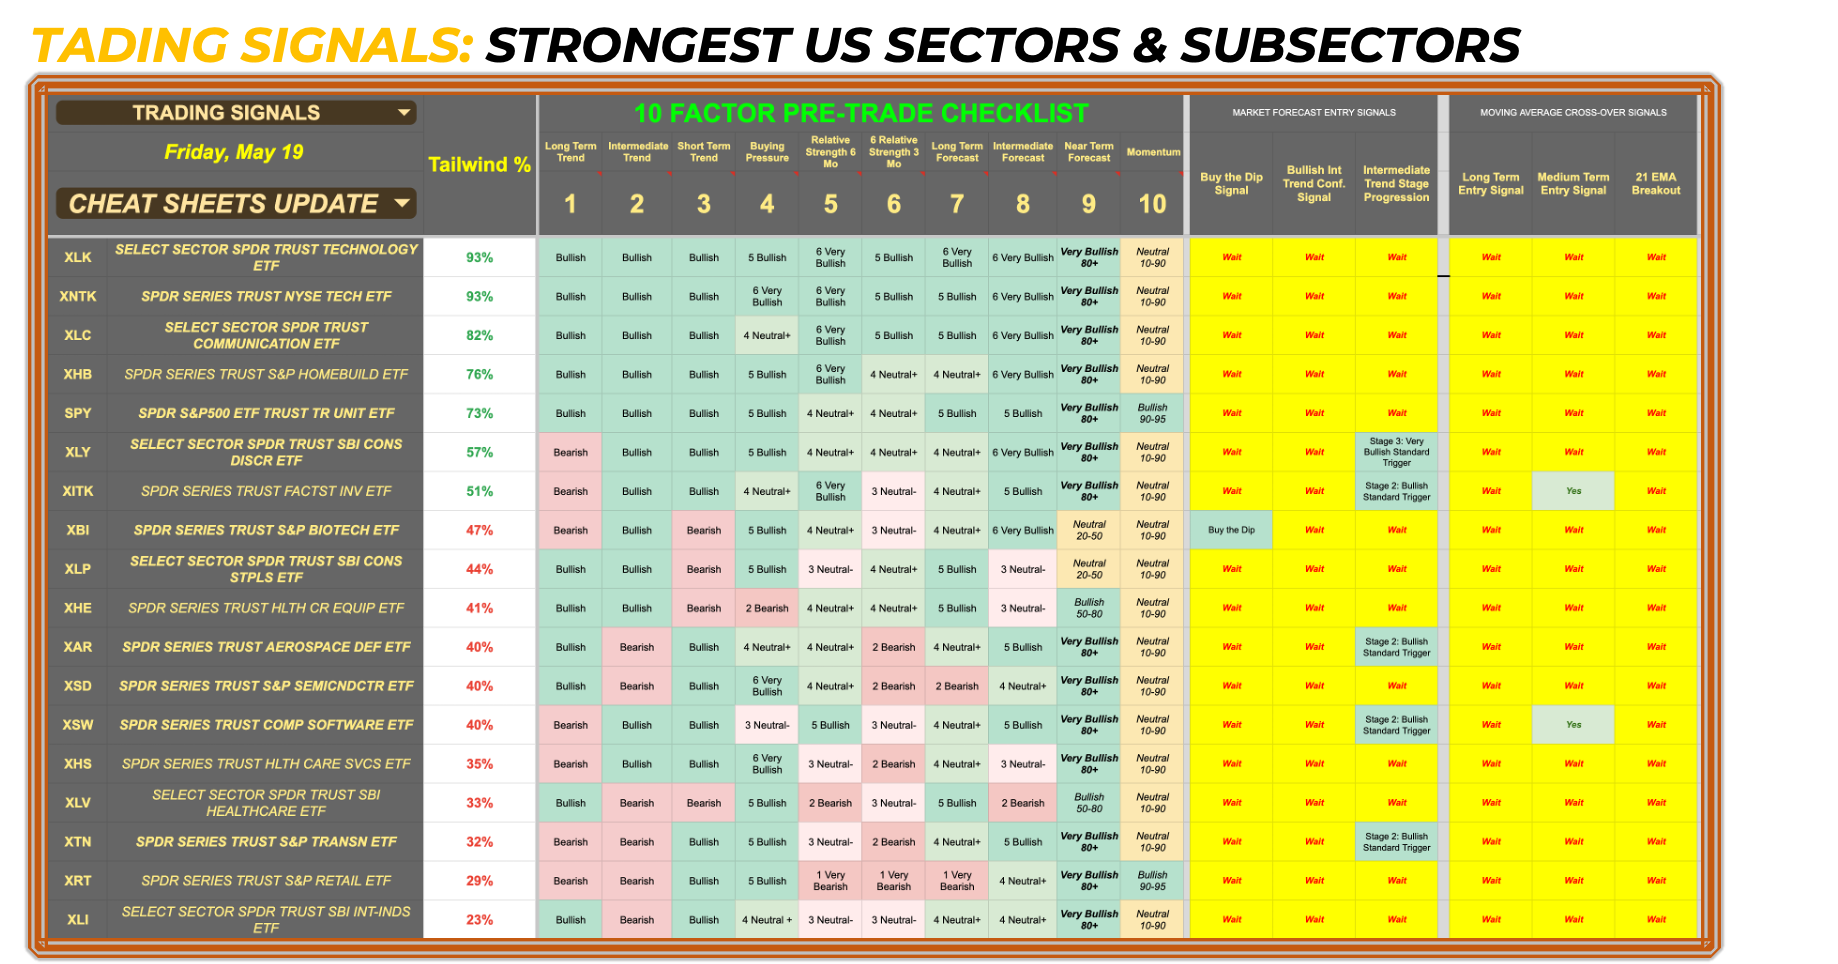
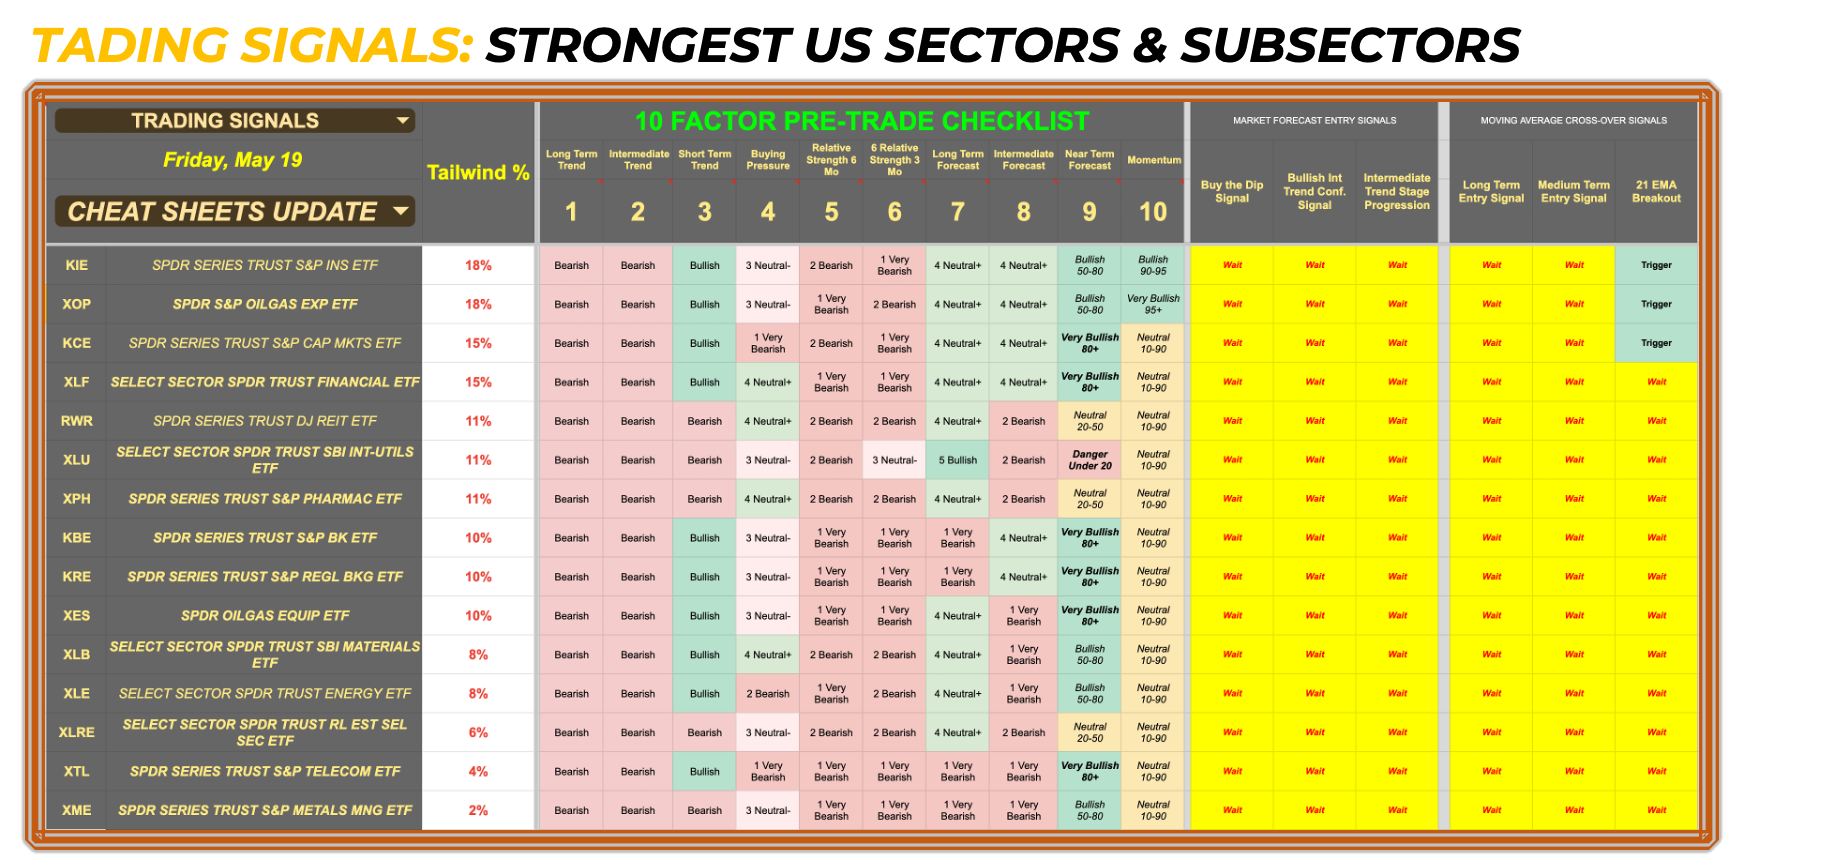
We’re still under 40% when we look at the US market’s aggregate Tailwind Scores. The move is narrow still. We’d prefer to see broader participation in a market index breakout. Jerome Powell’s words alone when he speaks today — if he were to double down on “even higher rates for longer” rhetoric or disabuse market participants about a “pause” in June - would be enough to upend tech and pin the market back under 4175.
Trend following strategies work better in Bullish overall market conditions.
Trading Signals - Open to All Members
Cheat Sheets All Access is Free. Get a look at global market conditions and relative strength trends delivered to our email weekly. Enjoy a one-week free-trial before upgrading to a Cheat Sheets Premium Membership
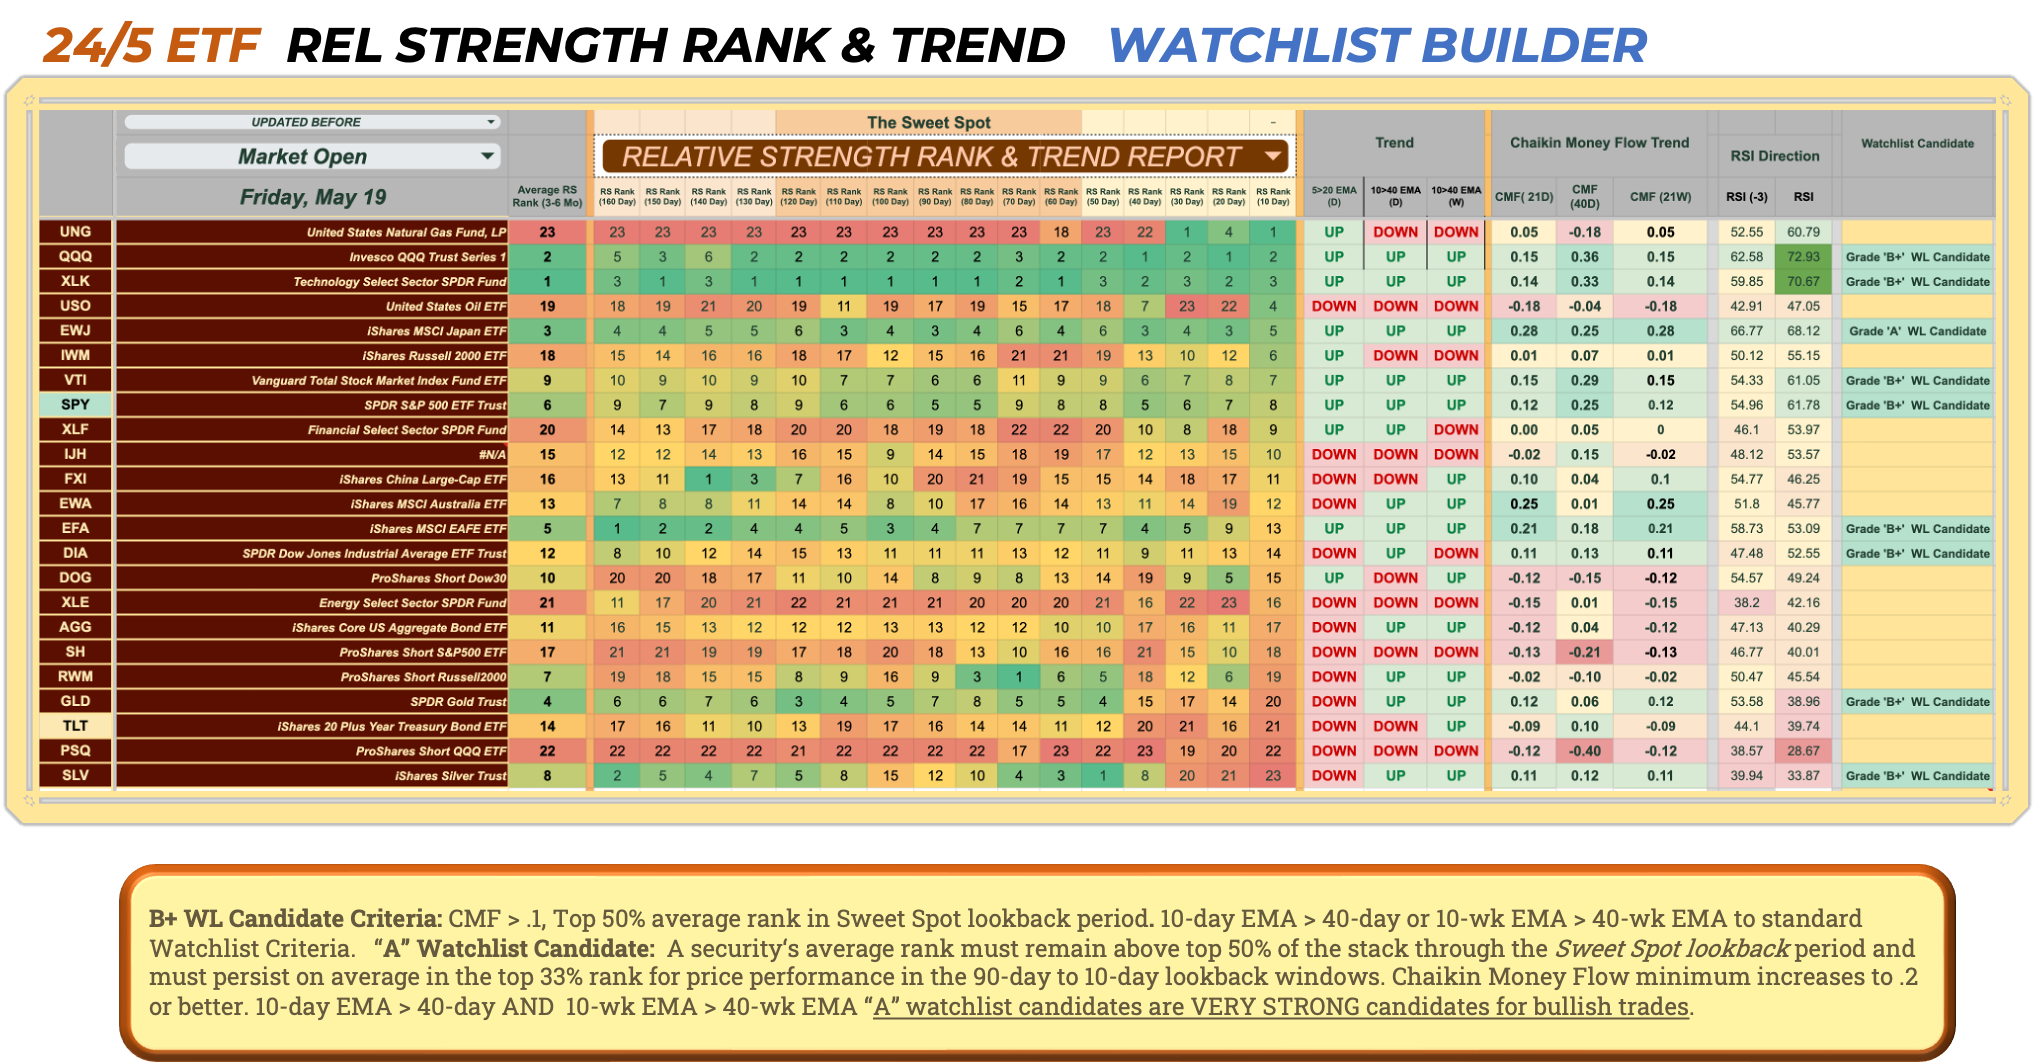
All Day Traded Global ETF Trading Signals & Relative Strength
The IWM’s Stage 2, Strong Trigger Intermediate Trend Confirmation buying signal is one of my favorite overall signals on Cheat Sheets. I cut a review video for this important trending indicator. DIA’s moving average daily 10/40 cross-over is supported by bullish money flow. An exit just under the 40 EMA makes for a nice reduced risked exit if the debt ceiling goes crazy.
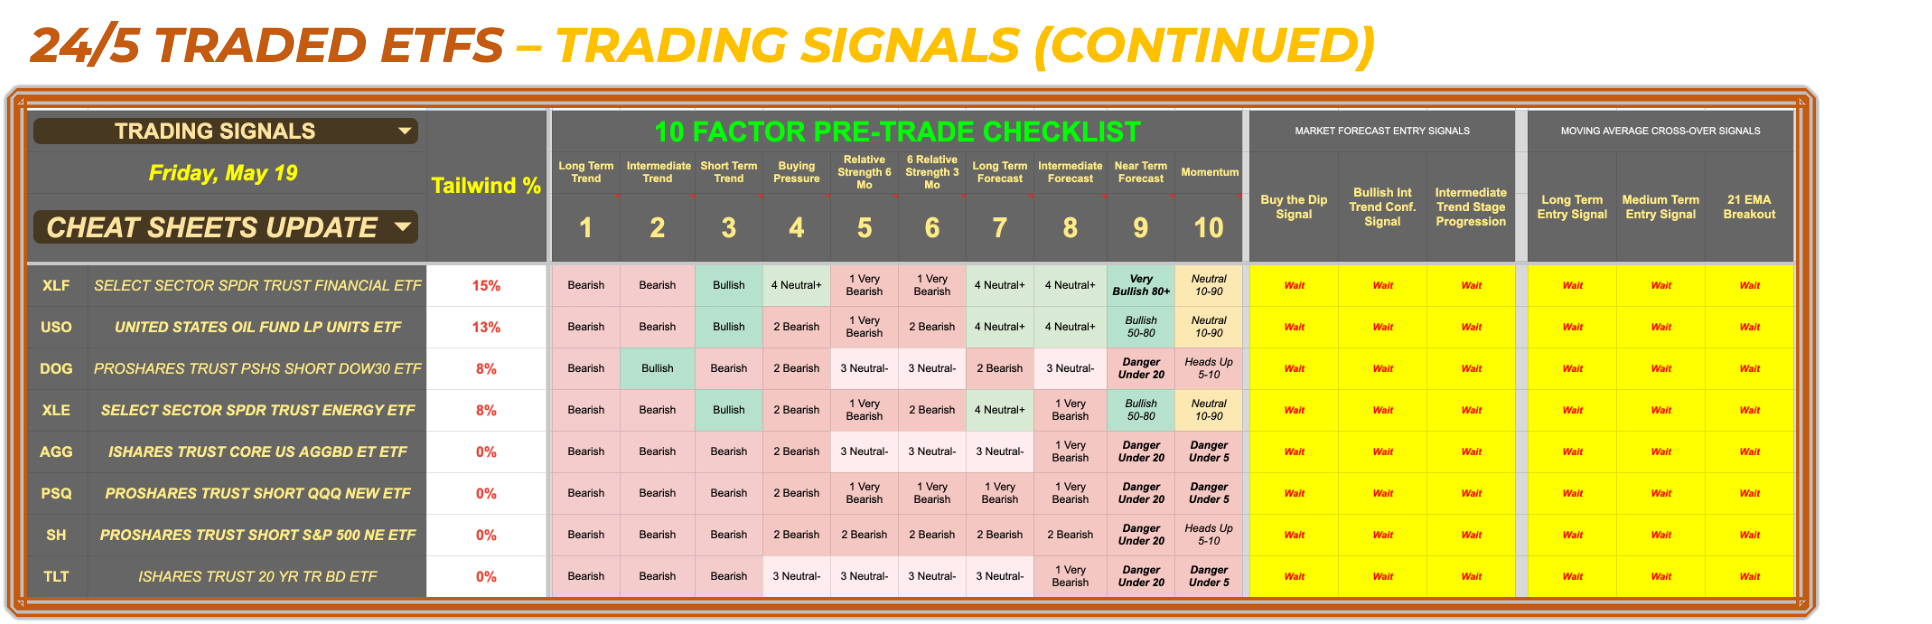
UNG
Inventories of the US natural gas in storage climbed by 99 billion cubic feet for the week ended May 12, the EIA said. Analysts called for a storage increase of 106 billion cubic feet on average, according to a survey conducted by S&P Global Commodity Insights. So the tighter supply expansion caused a price spike.
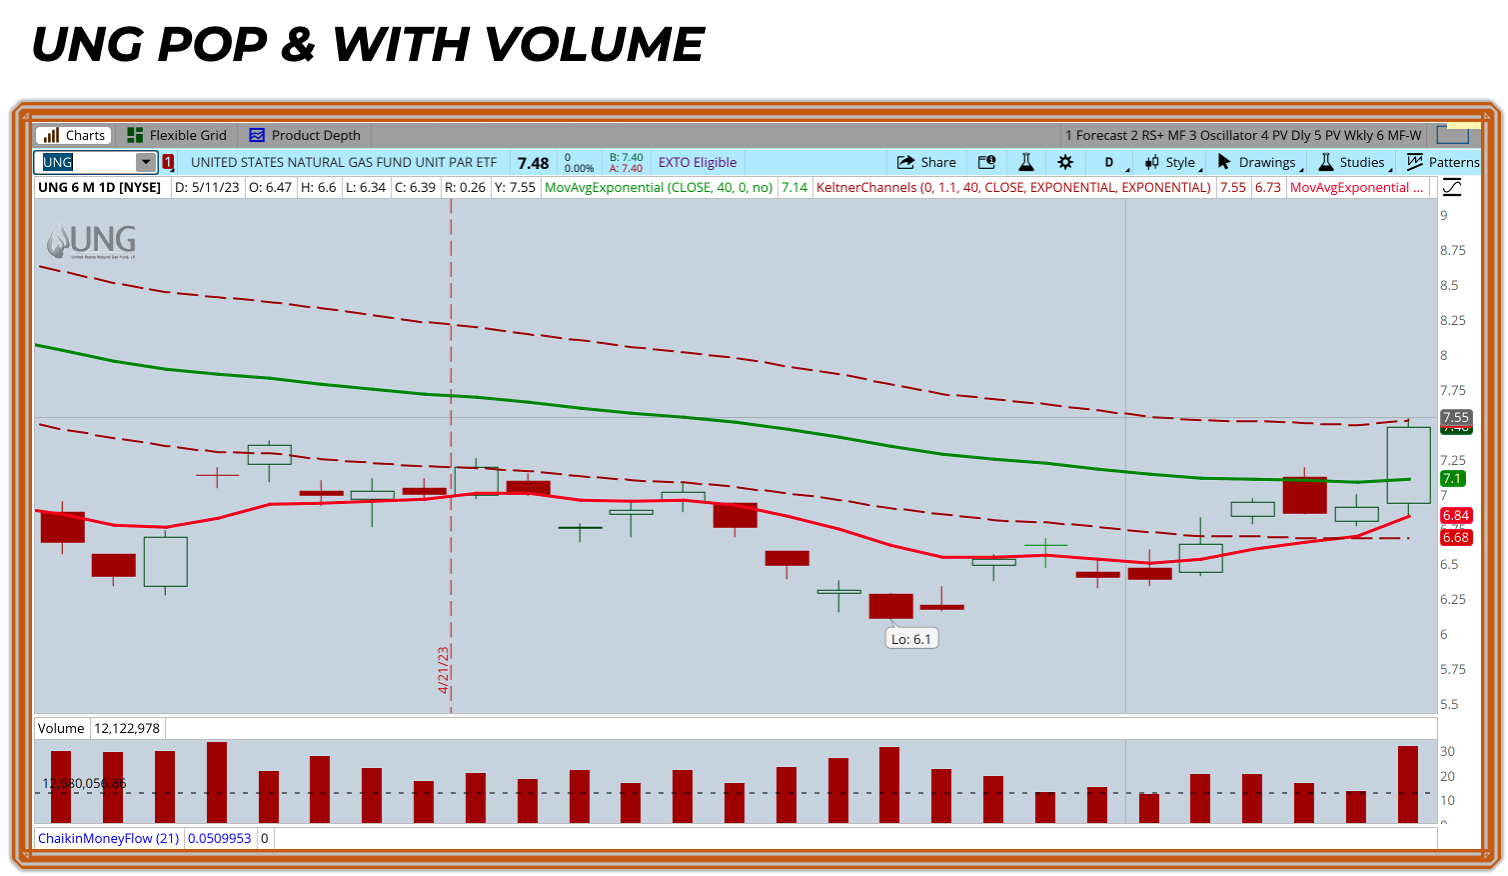
Tech and Tech related Media stocks are driving the market right now. But, We are seeing movement elsewhere, Homebuilders and Consumer Discretionary, for example.
PREMIUM CHEAT SHEET STACKS - SUBSCRIBERS
Trading Signals User Guide - Click Here
Relative Strength Rank & Trend Trend Stack User Guide - Click Here
Other Stuff
Onboarding Link: Here This is a comprehensive 2.5 hour introduction to Cheat Sheets
Disclosure about Trading Risk
Take advantage of our free and premium email subscriptions. Get Cheat Sheet Trading Signals and Relative Strength Reports delivered via email each week. There is a 7-day Free Trial available for free-subscribers wishing to try Cheat Sheets Premium
