

Weekend Watchlist Builder - Energy Commodity ETFs and Stocks Dominate Relative Strength Reports
Energy Sector Stock Picks Inside for Premium Subscribers

For best viewing, click to enlarge each stack and view it on a computer. Stock Cheat Sheets, including market conditions, trading signals, and relative strength rank & trend reports for index ETFs are delivered free to the inbox of All Access Members every week.
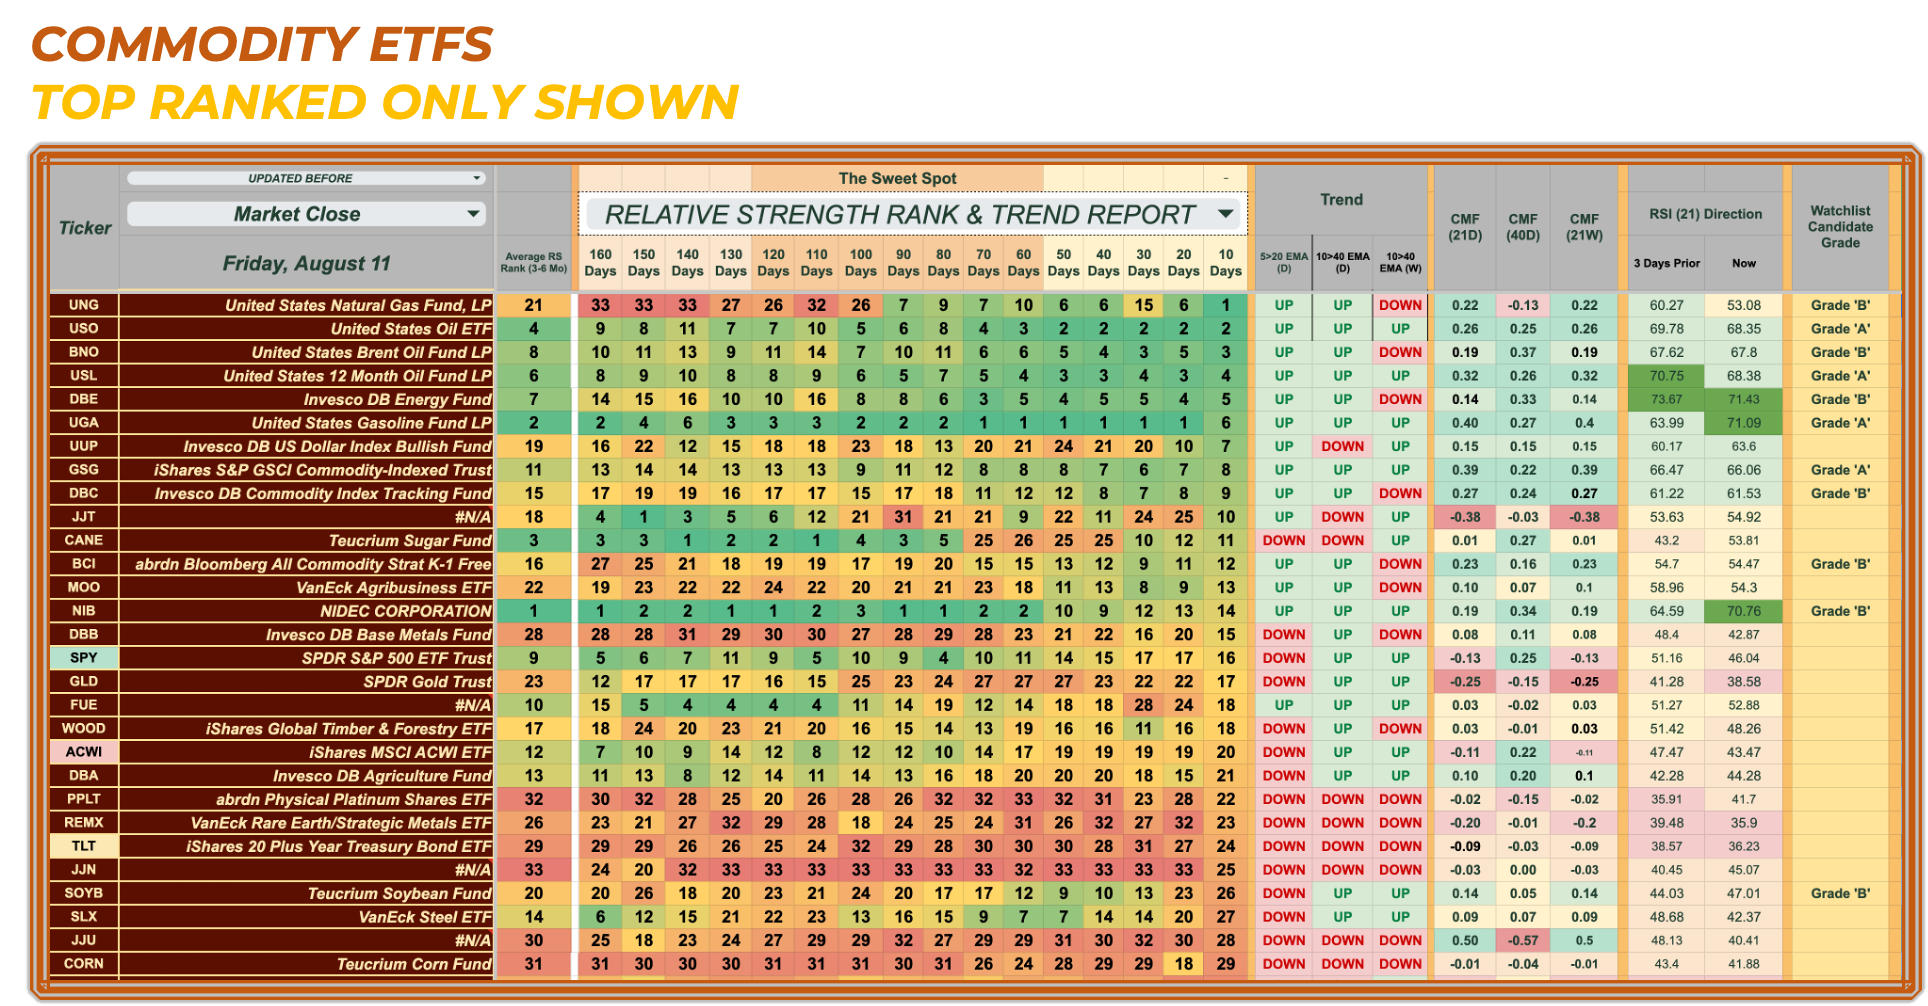
Relative Strength Rank Trend Reports
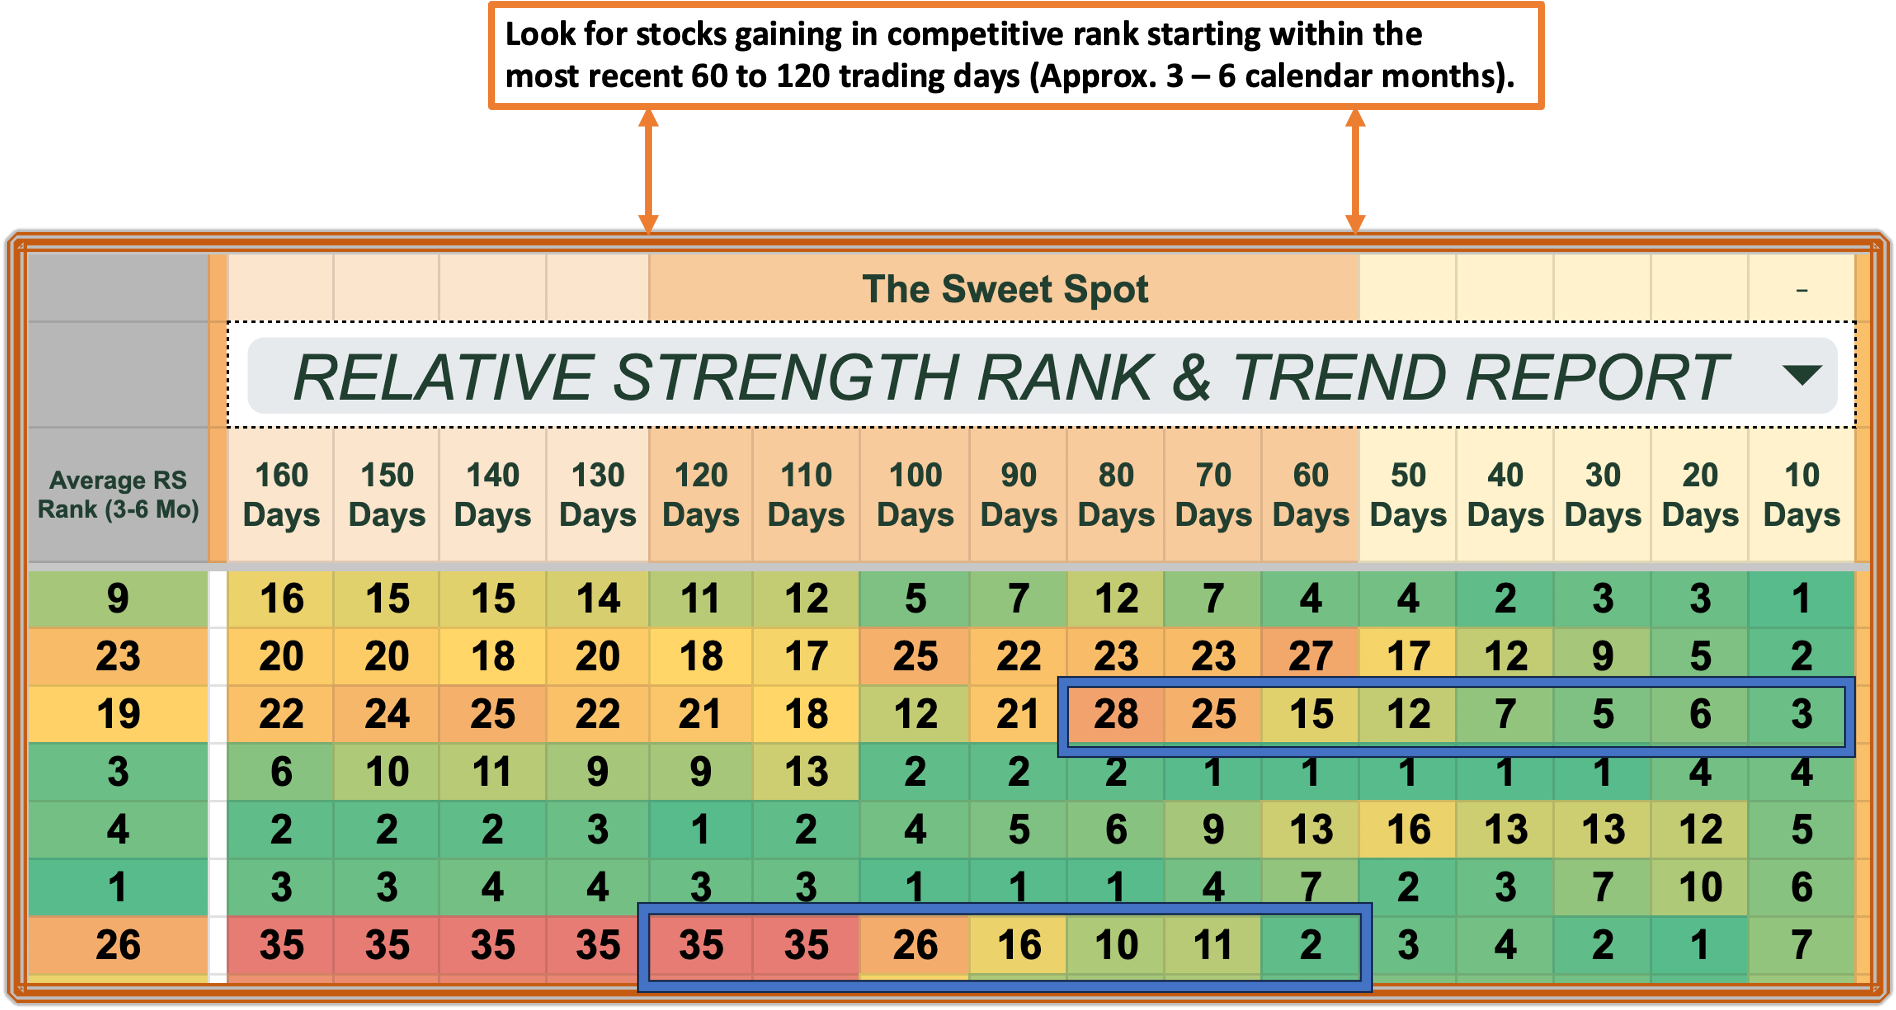
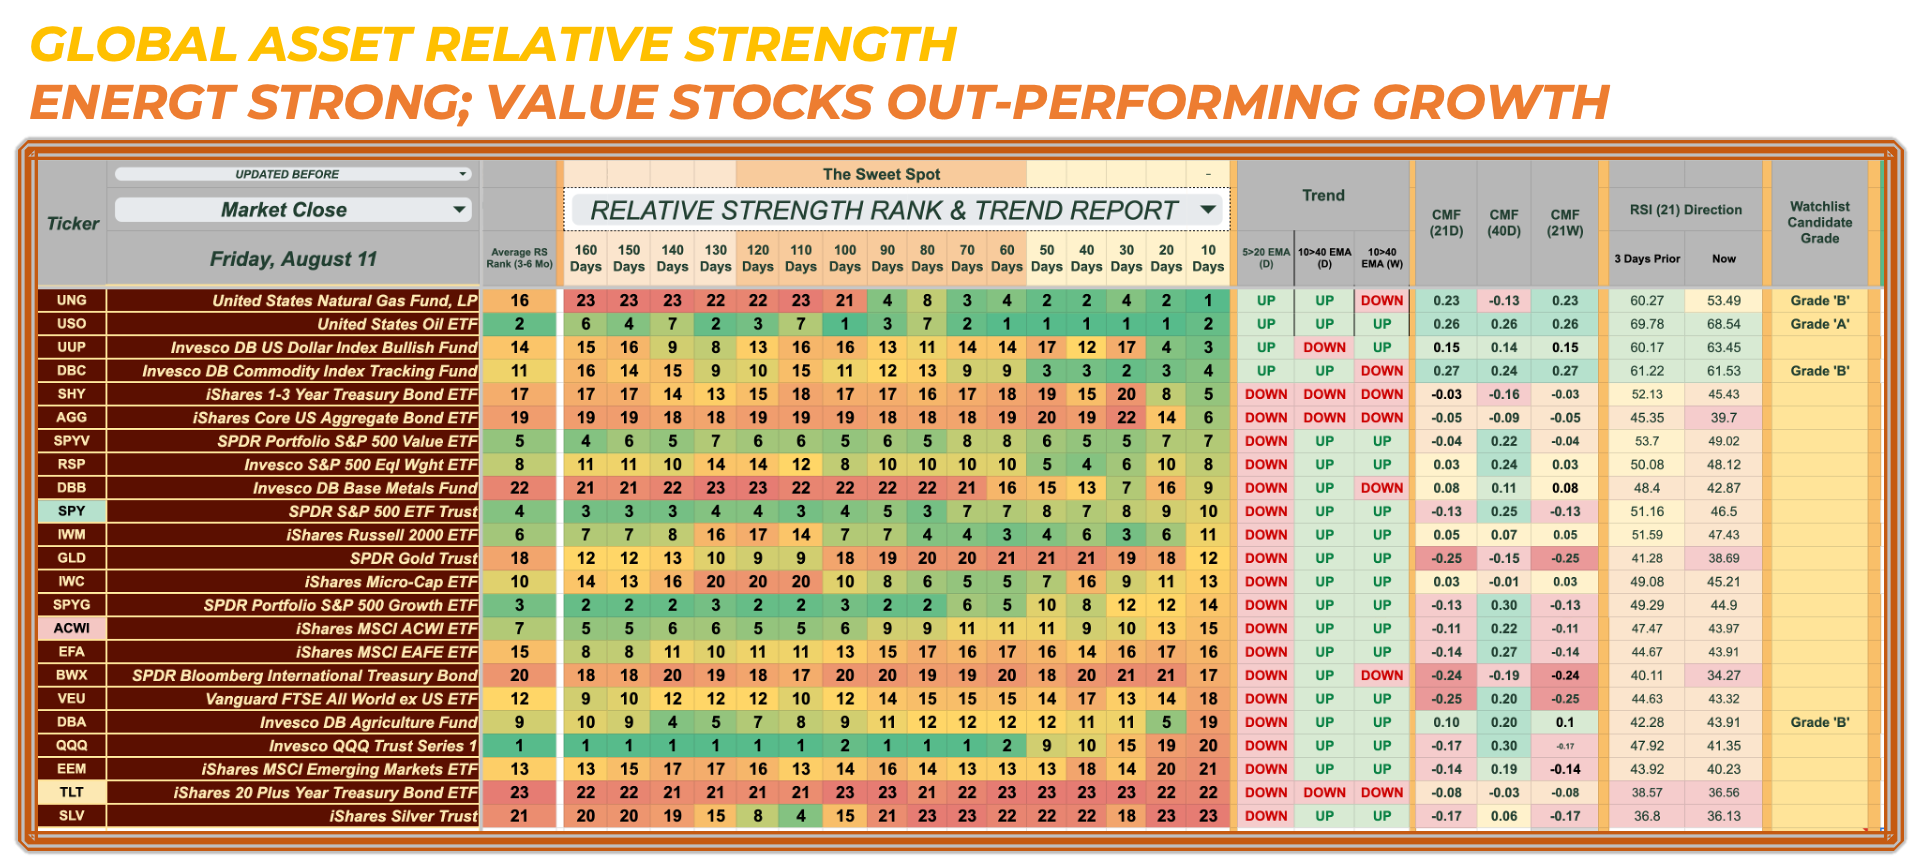
Gas and Oil are outperforming equities at the moment, and energy-related company stocks are strengthening. We’ll have Quantamental Killer picks for premium subscribers after we share our global relative strength assessment.
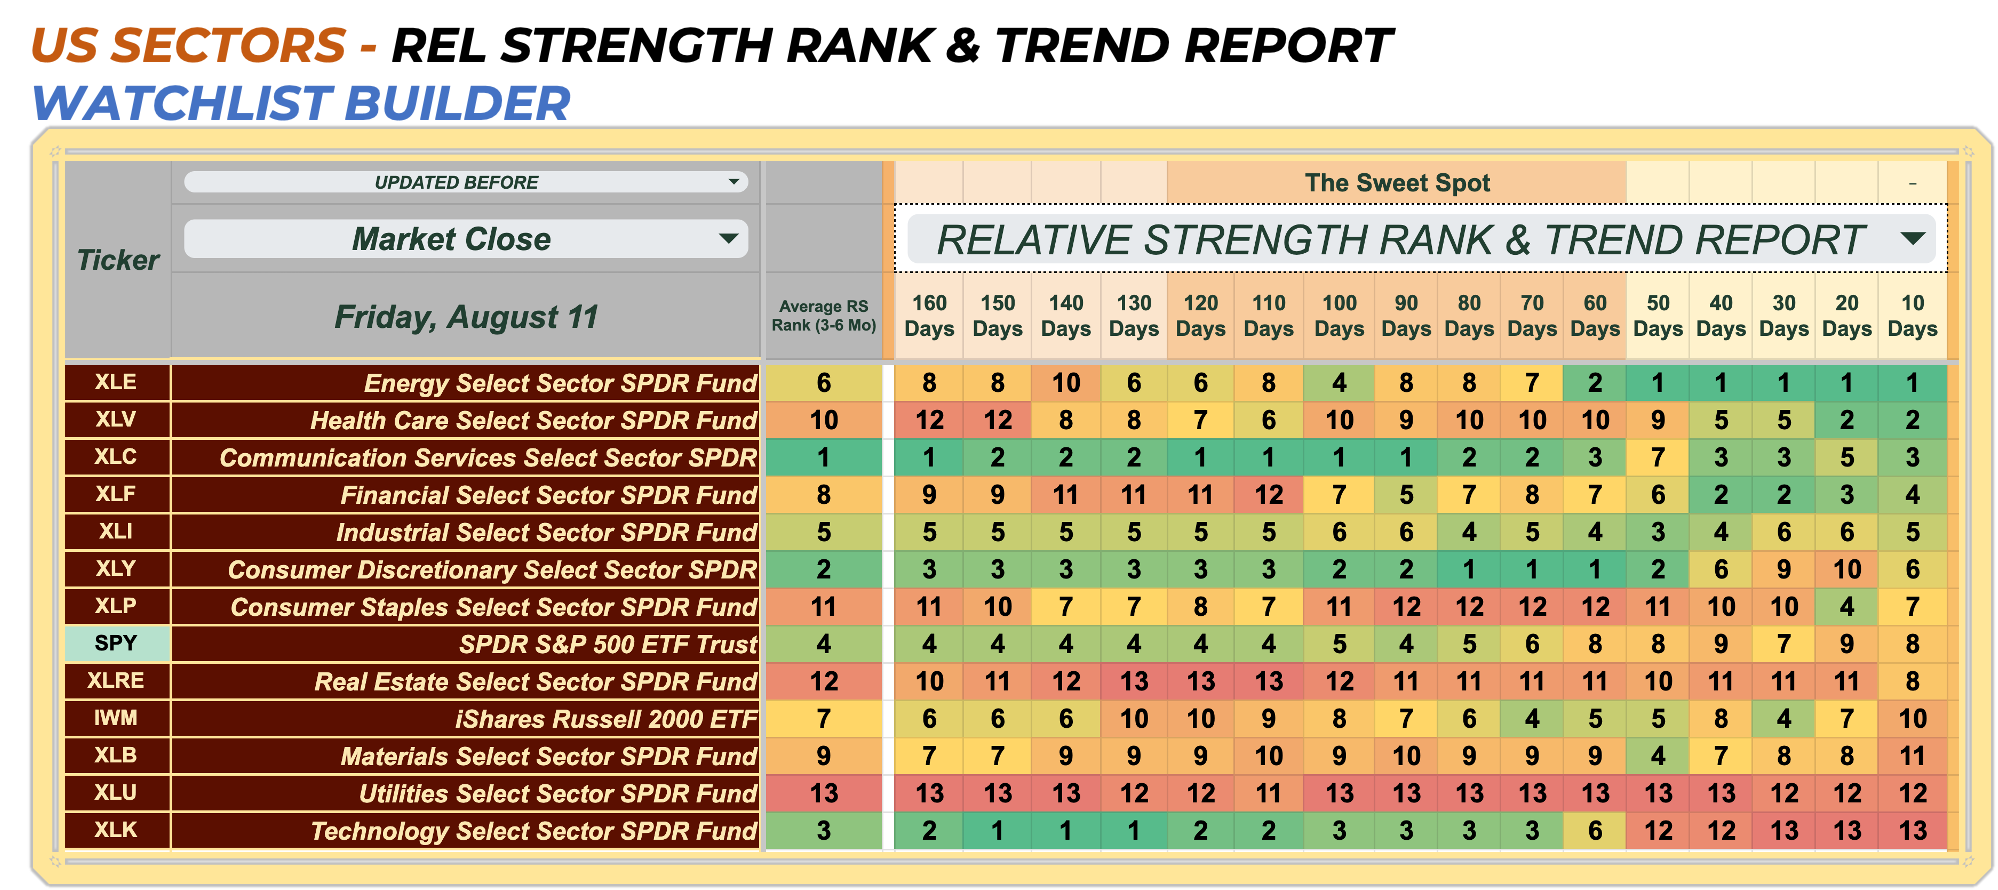
US Sectors
In the past 90 trading days, XLE’s (Energy) competitive rank among US stock sectors has risen from 8th to 1st. XLF (Financials) has moved from 12th to 4th in relative strength ranks over the most recent 110 trading days. Despite dips, both XLI (Industrials) and XLC (Communications) have maintained their competitive rank in the top half among US sector ETFs
Over the past 70 trading days, XLK (US Tech) has dropped from 3rd to 13th. It’s important to pay attention to money flow to confirm that bearish rotation.
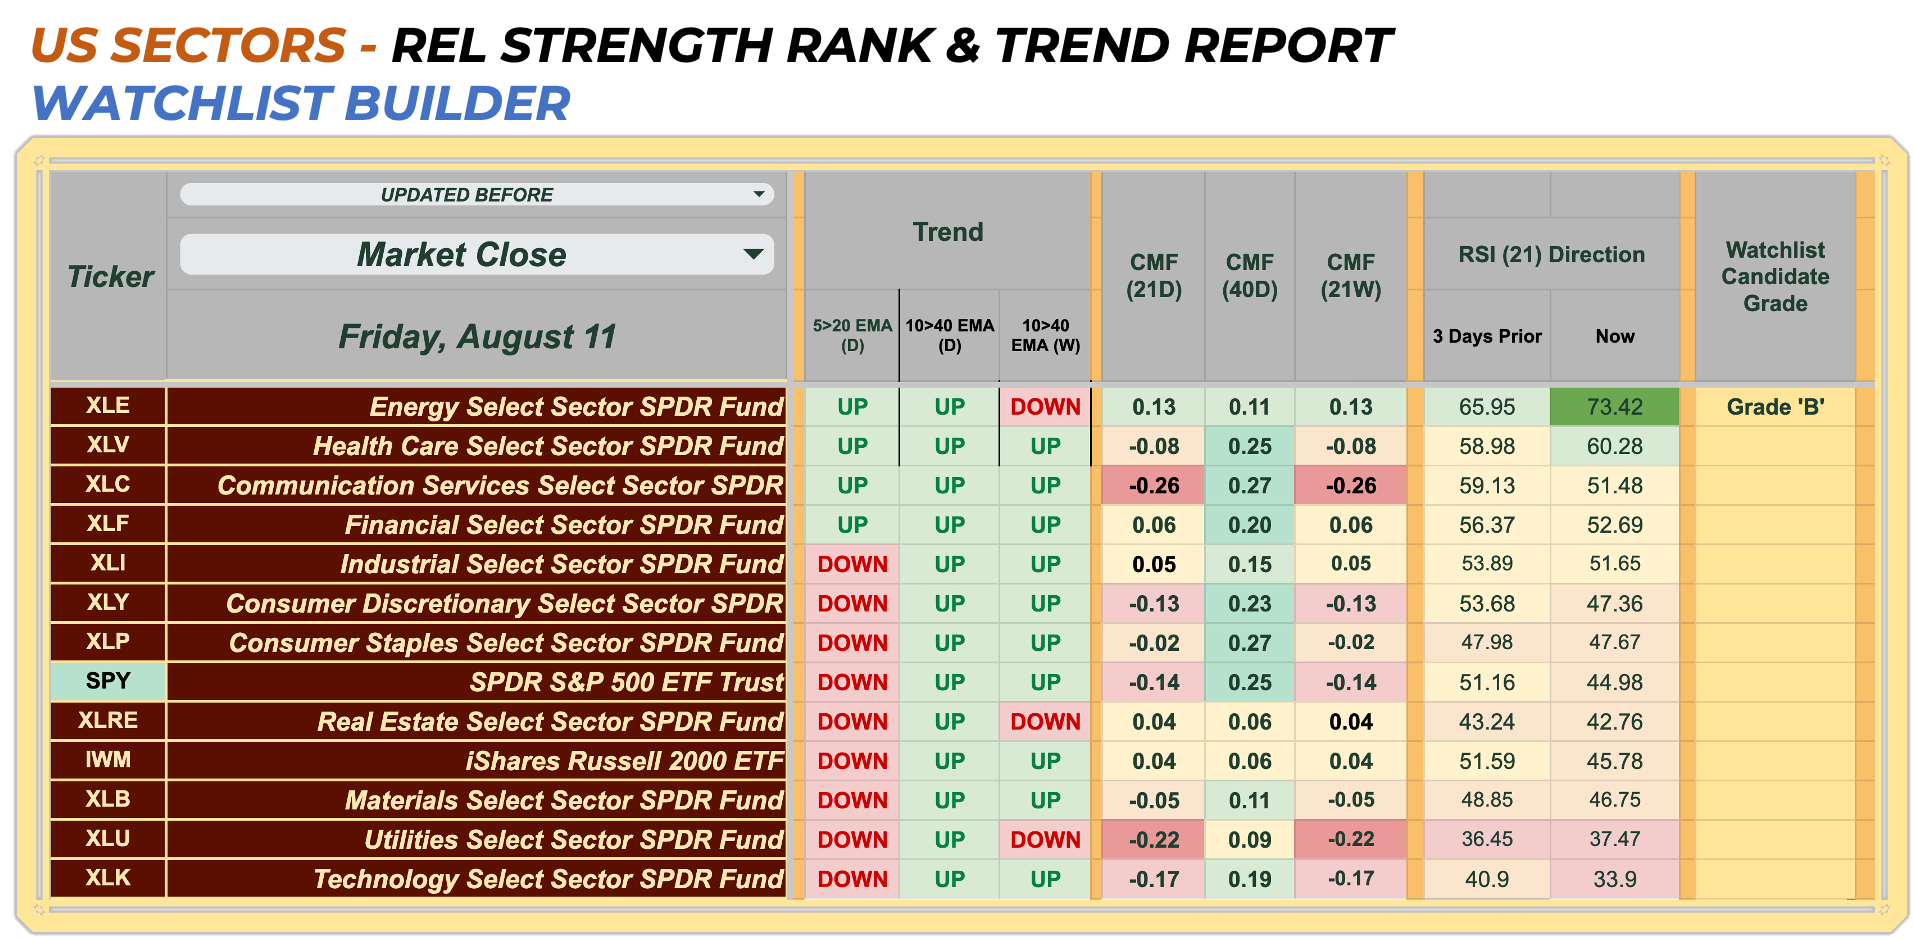
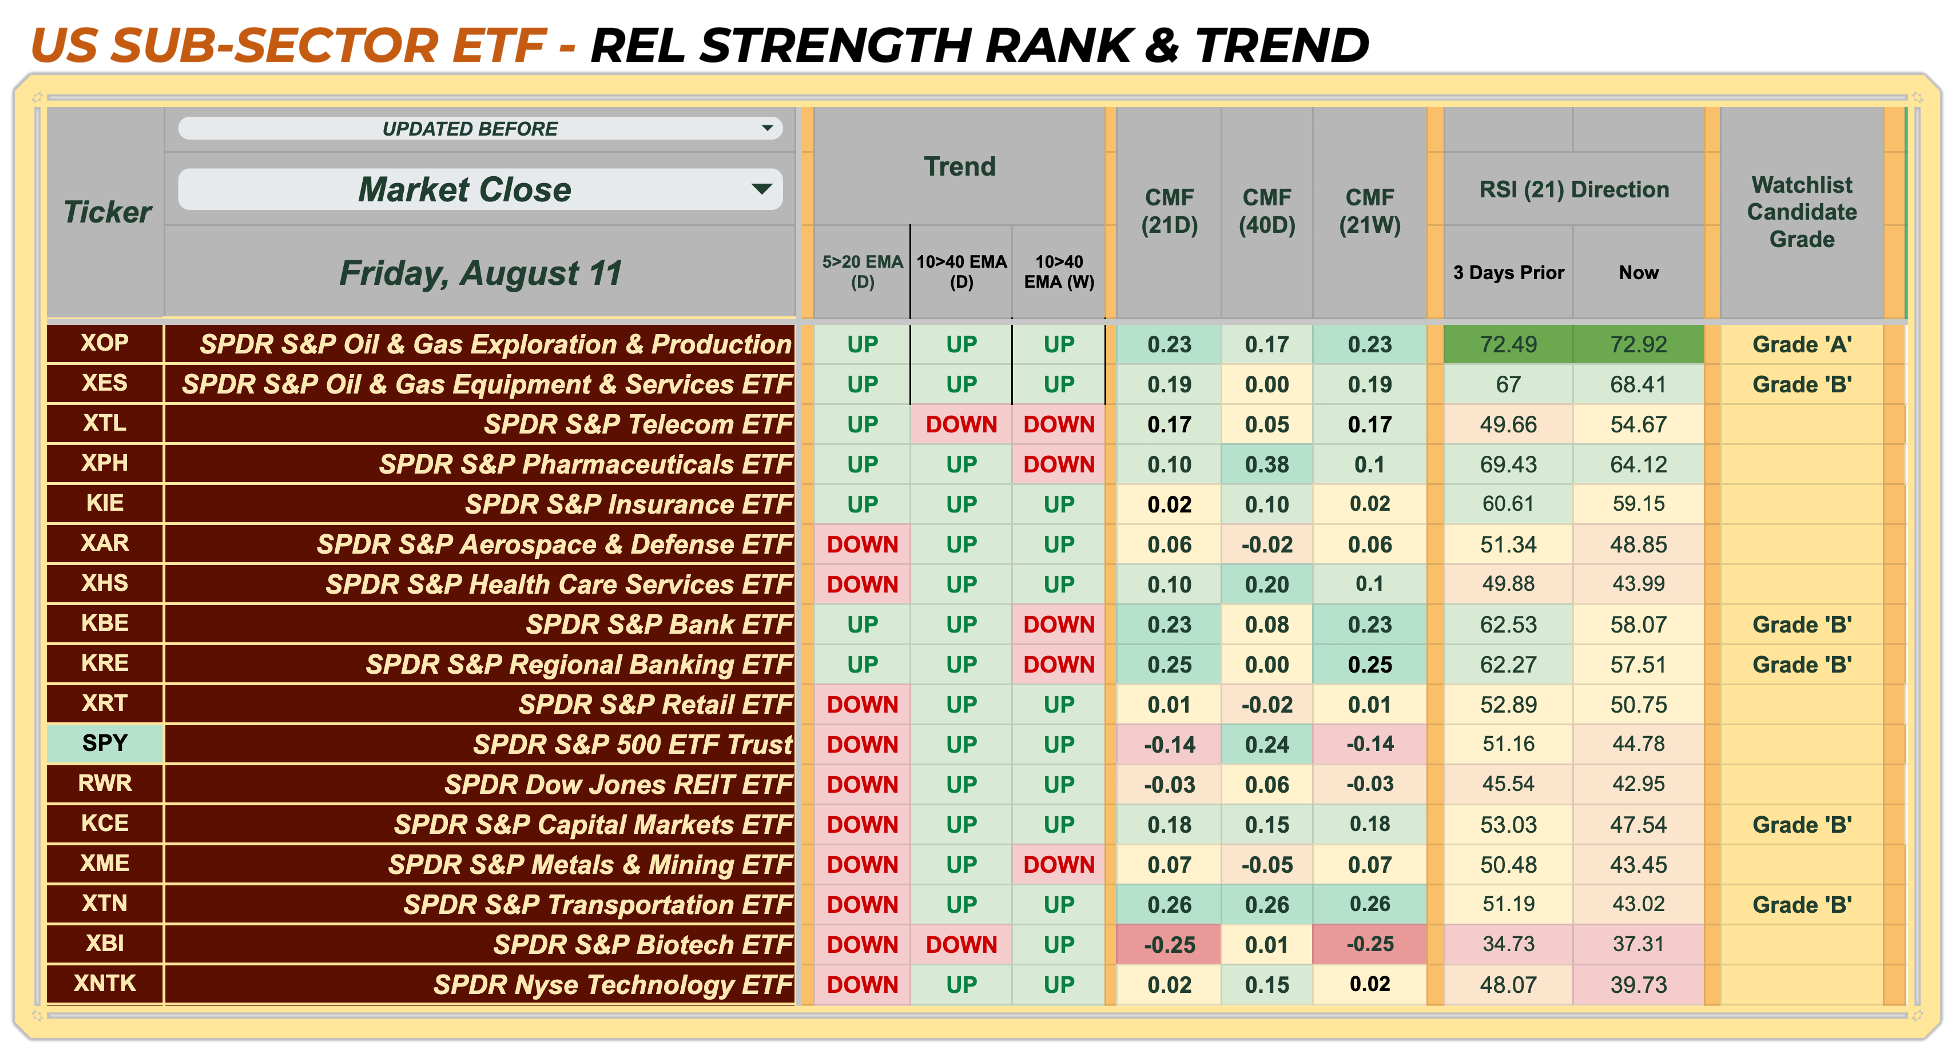
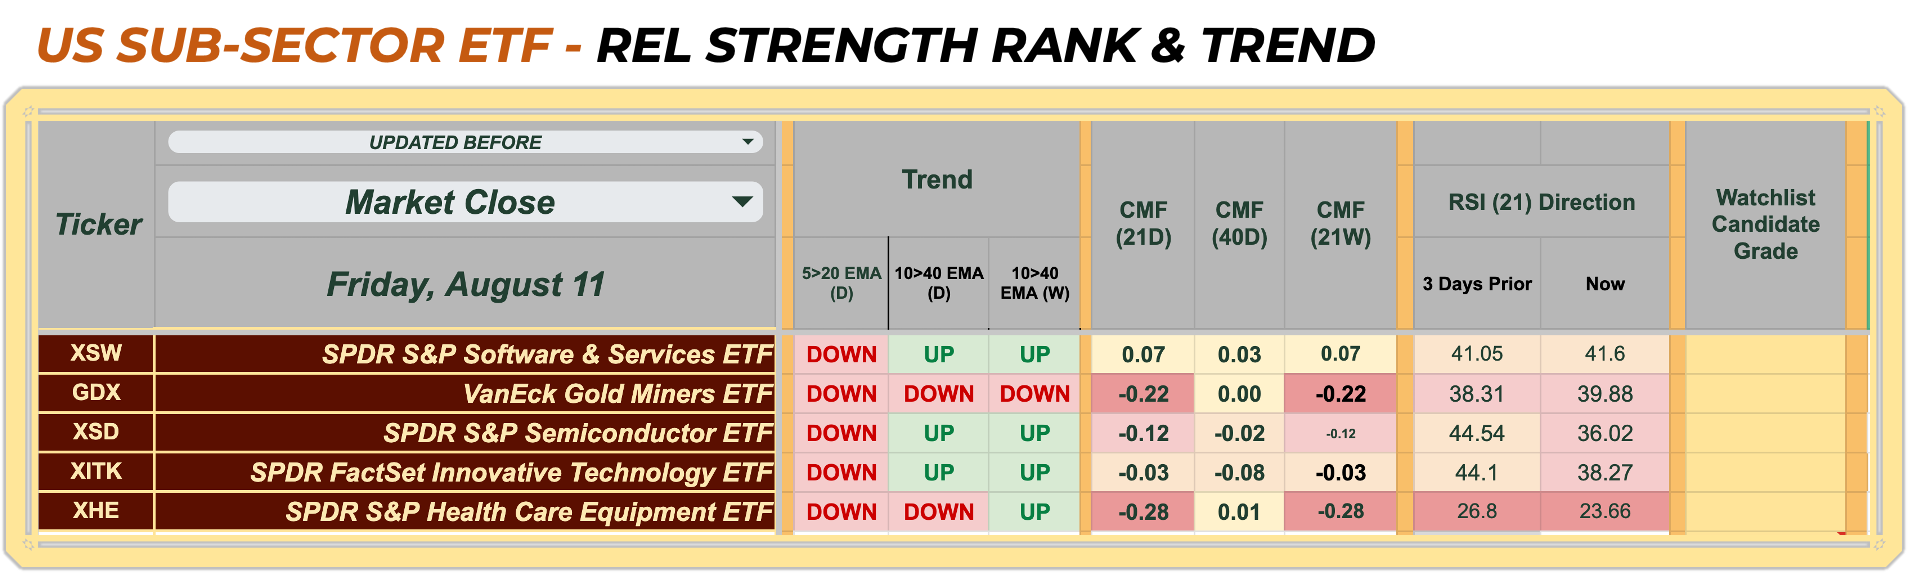
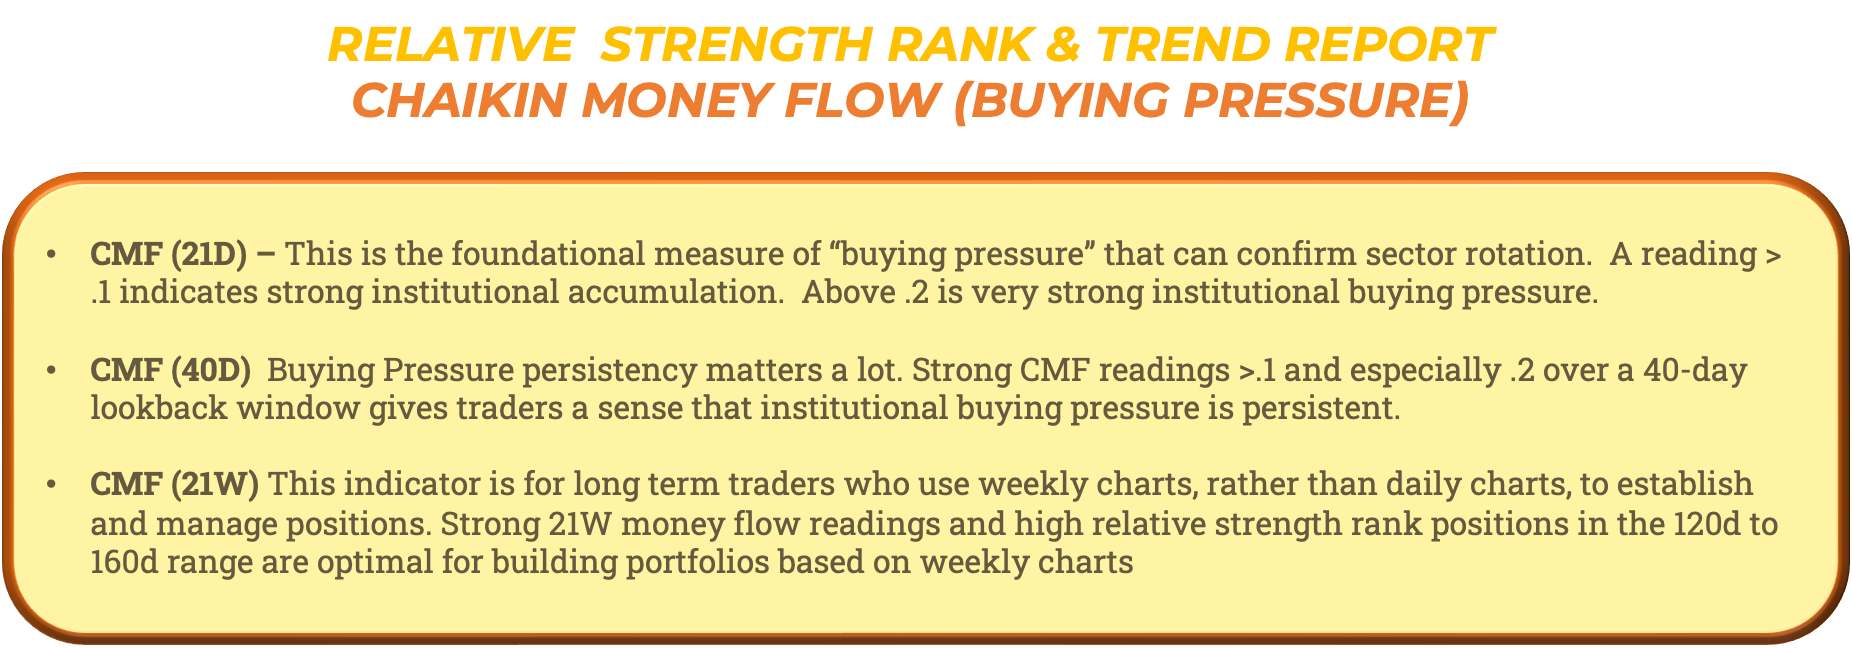
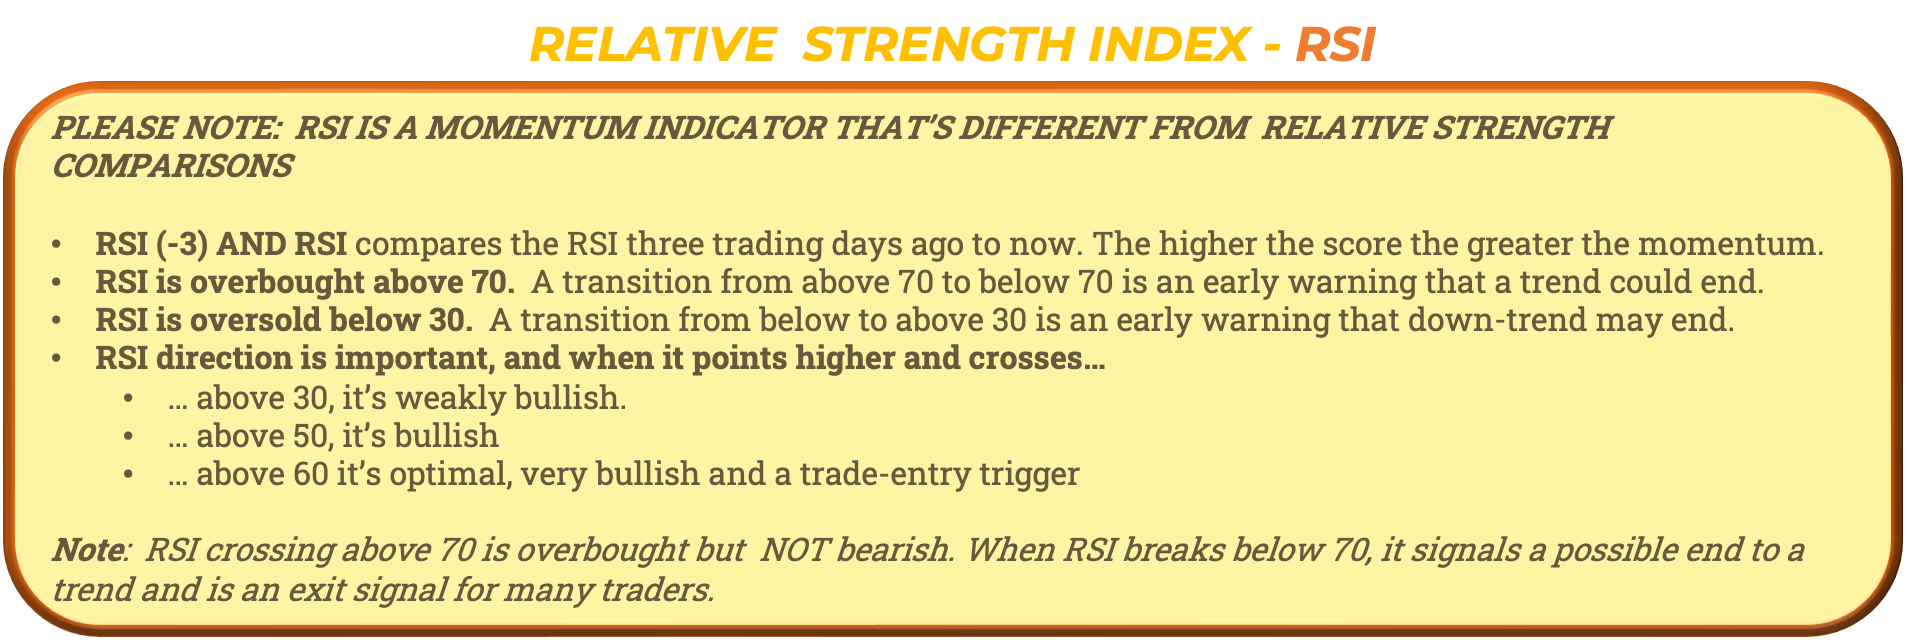
XLE’s short-term and intermediate trends are bullish, and money flow is above .1, which means that institutions are accumulating the stocks (and in multiple timeframes). RSI continues to rise. Over the past three days, it’s entered the overbought zone, above 70. However, stocks with high RSI’s can stay overbought for quite some time. A sell signal comes only after the RSI drops below 70. Take note that the energy ETF is the only US sector showing bullish CMF in the key 21-day lookback period.
XLK has weak money flow and a falling RSI, the combo confirming the intermediate bearish relative strength trend. While the 10/40 daily EMA pair remains bullish and the trend is not yet broken, this combination of bearish factors can help propel the tech center pullback further or lock in a sideways trend from weeks to a couple of months before recovery.
Subsector ETF
Energy and Tech sub-sector ETFs mirror the story above.
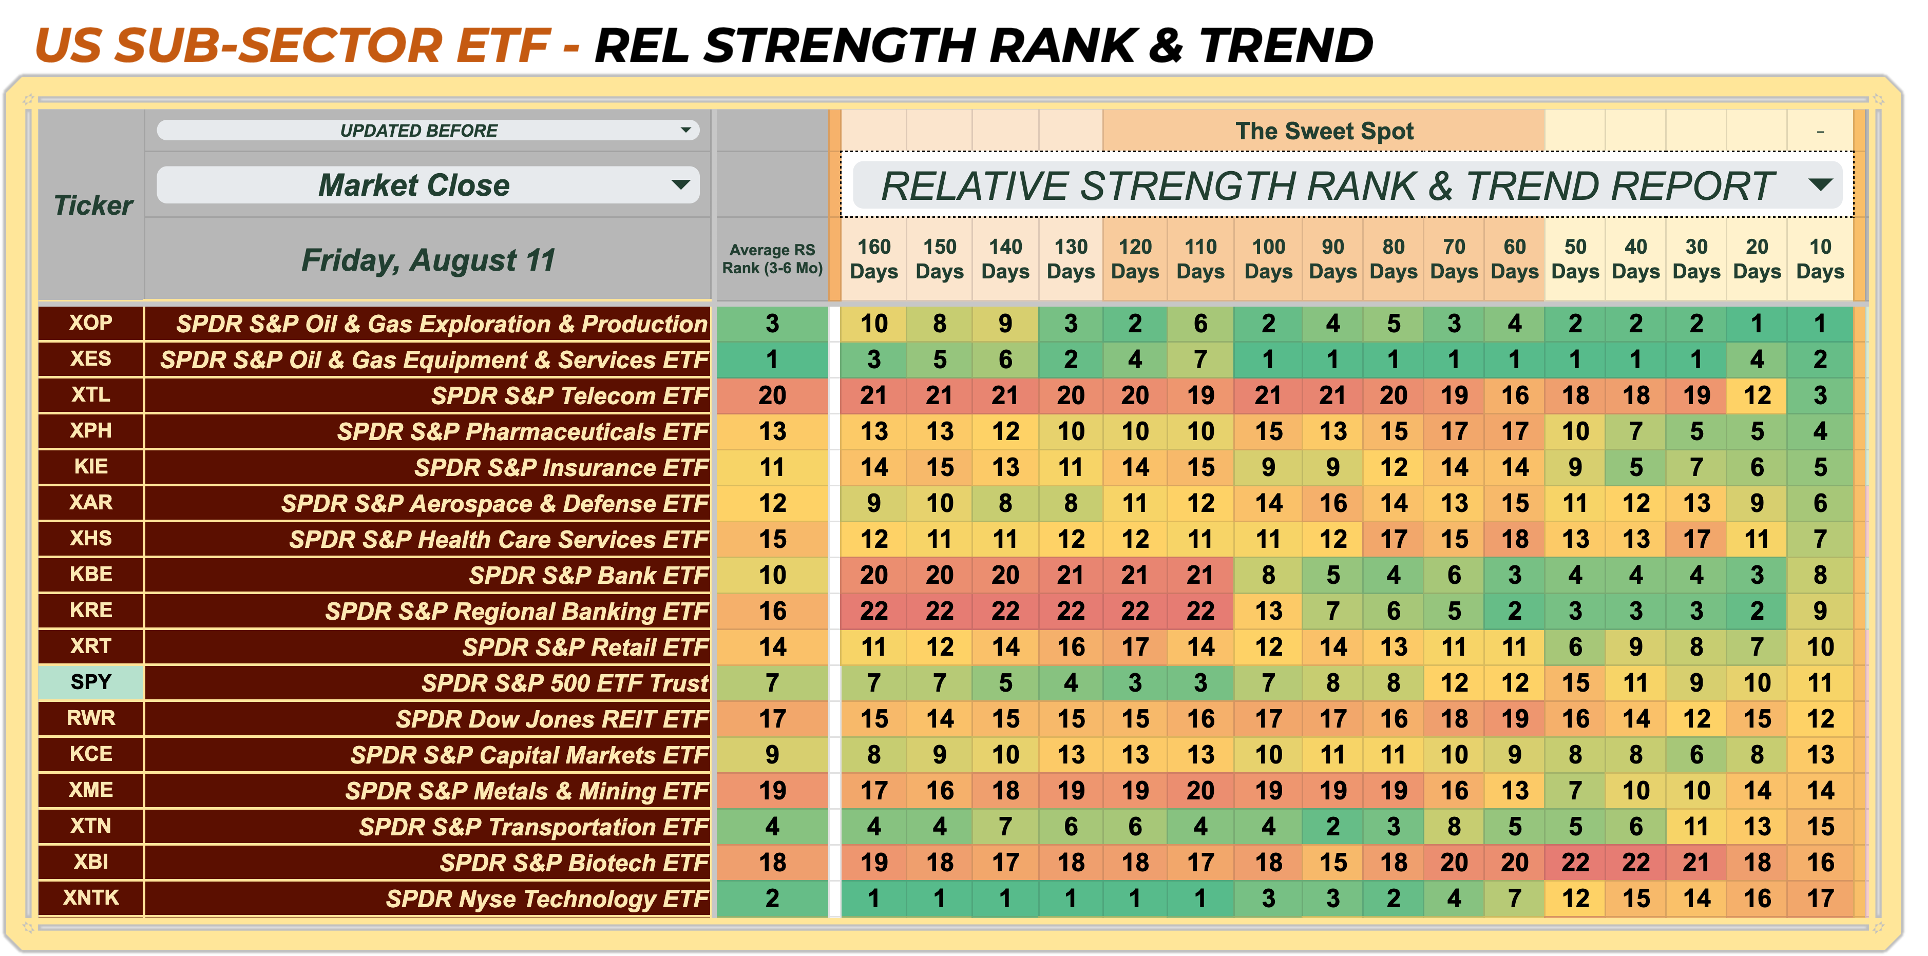
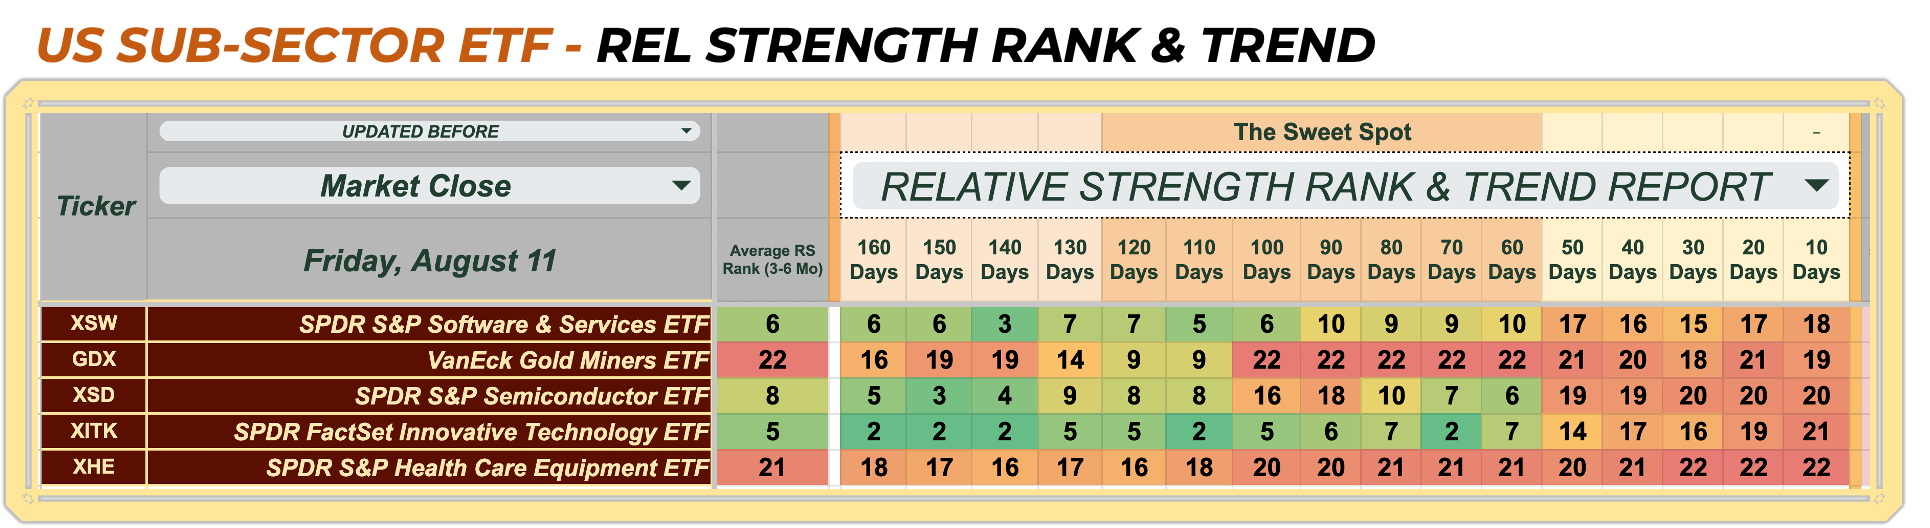
Click to enlarge the following and view on a computer.
Cheat Sheets is a data service to help traders improve decision-making. The author/architect of Cheat Sheet Sheets shares educational concepts related to the skill of trading but will not dispense personal financial guidance. All trades showcased are for demonstration purposes in a simulated investing environment. More Risk Disclosure . Disclosure about Trading Risk
Take advantage of our free and premium email subscriptions. Get Cheat Sheet Trading Signals and Relative Strength Reports delivered via email each week. There is a 7-day Free Trial available for free subscribers wishing to try Cheat Sheets Premium
Premium Cheat Sheets Stacks
Let’s take a look at the top-rated single-company stock tickers in the energy sector. We’ll run these highly-liquid, single-company stock holdings through a Cheat Sheet Quantitative Analysis. But we’ll tighten up our selections so that only stocks with favorable fundamental ratings make the cut. That means companies with bullish financial ratios, low valuation metrics, strong analyst ratings, and aggressive insider buying. These stocks are trading in the strongest parts of the market and are earning the favor of richly bankrolled institutional investors. The result? Quanta-mental Killers Stacks. With these stock selections, the wind is at your back.
