


Today, we show you why the stock market bull could be on its last legs, though we remind ourselves to trade what we see and not what we think. These indicators are essential tools for assessing whether the stock market is overvalued or undervalued compared to historical norms, providing insights into potential future returns and risks.:
1. Price-to-Earnings (P/E) Ratio
Explanation: The P/E ratio measures how much investors are willing to pay for each dollar of a company’s earnings. It’s calculated by dividing the current stock price by earnings per share. A high P/E ratio suggests that stocks are expensive relative to their earnings, indicating potential overvaluation. Historically, when P/E ratios are elevated, future returns tend to be lower.
2. Shiller P/E Ratio (CAPE)
Explanation: The Shiller P/E ratio, also known as the CAPE ratio, adjusts the traditional P/E ratio by averaging earnings over the past 10 years and adjusting for inflation. This smooths out short-term fluctuations and provides a long-term view of market valuation. A high CAPE ratio signals that stocks are more expensive compared to historical averages, which could lead to lower long-term returns.
3. Price-to-Sales (P/S) Ratio
Explanation: The P/S ratio compares a company’s stock price to its revenue per share. It’s useful for evaluating companies that may not yet be profitable. A high P/S ratio indicates that investors are paying a premium for each dollar of revenue, which can be a sign of overvaluation, especially if profit margins are thin or declining.
4. Buffett Indicator (Market Cap-to-GDP)
Explanation: The Buffett Indicator compares the total value of the stock market to the country’s GDP. It’s a broad measure of whether the market is overvalued relative to the size of the economy. When the ratio is high, it suggests that the stock market is more expensive than the underlying economy, which could lead to a correction if economic growth doesn’t keep pace.
5. Dividend Yield
Explanation: The dividend yield measures the annual dividend payments as a percentage of the stock price. A lower yield often suggests that stocks are overvalued, as investors are accepting lower income returns in favor of capital gains. Historically, higher yields have been associated with better future returns, while lower yields indicate higher valuations and potentially lower returns.
6. Corporate Earnings Growth vs. Stock Prices
Explanation: This indicator compares the growth rate of corporate earnings to the rise in stock prices. When stock prices increase faster than earnings, it can signal that valuations are becoming stretched. Over time, if earnings do not catch up to price levels, the market may experience a correction to realign valuations with fundamentals.
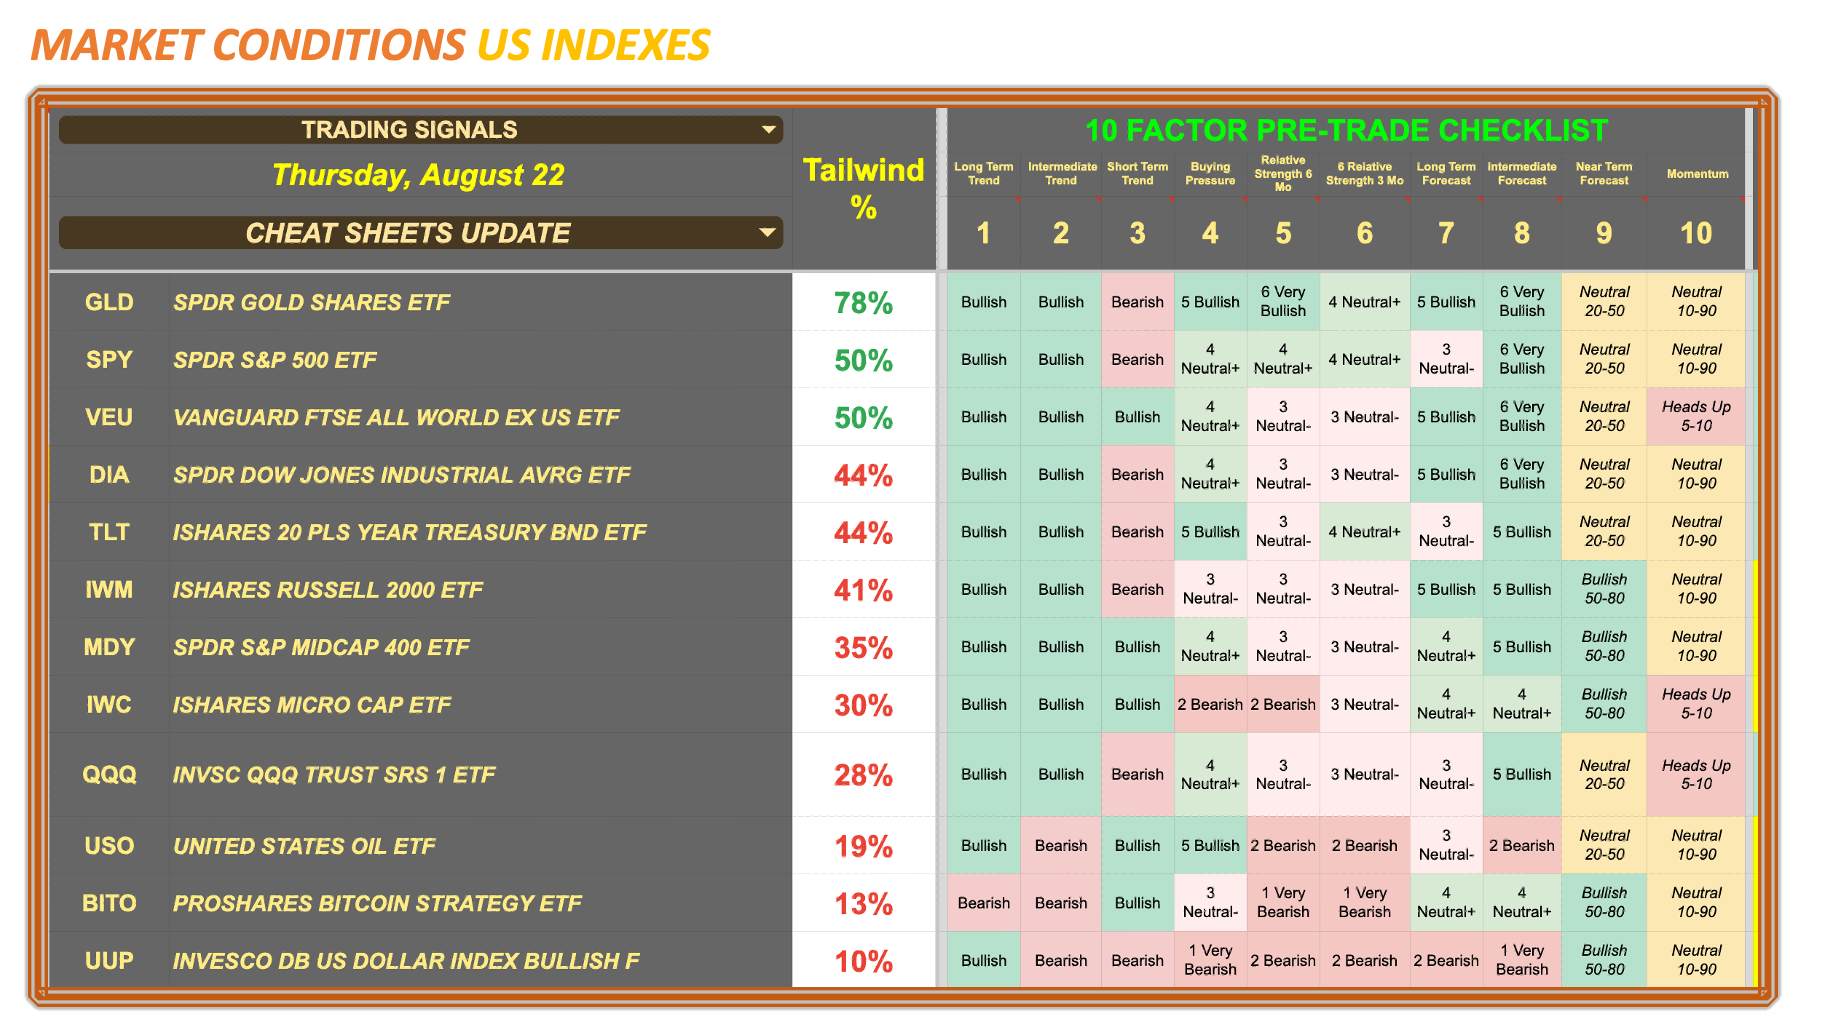
Here are the visual aids that go along with the rest of this week’s podcast. Remember to click to enlarge and view on a computer.


Share this post