


Scroll down to see our 110+ Ticker Relative Strength Rank and Trend Report. First, we give you a snapshot from the first in an expansive five pages of Relative Strength data incorporated into Trend Analysis and Money Flow Modeling. Overall, we’re covering 112 sub-sector and industry group ETFs . So we’re picking our highlights carefully. New subscribers: the video above will help you make your way through the data efficiently. For Cheat Sheets veterans, instead of simply repeating the analysis in the article below in the video, we’ve expanded our coverage instead. We’ve added additional sub-sector commentary and a new twist on QuickView Charts. The multi-colored Exponential Moving Average now has a 5-day, 21-day and a 40-day EMA option. We’ve found success with a green 5-day EMA on ESPO (the gaming ETF). You’ll see why when you watch.
📊Bullish ESPO ETF: VanEck’s Video Gaming and eSports ETF Is a Poster Child of Persistency
I can’t remember the last time that ESPO didn’t rate highly in our Relative Strength Rank & Trend (RSRT) report. This VanEck Video Gaming and eSports ETF consistently earns its A-rating due to its unique position at the intersection of technology, entertainment, and digital consumer trends, offering exposure to a resilient, high-growth sector driven by global gaming adoption, recurring revenue models, and strong demographic tailwinds. Technically, ESPO maintains leadership with persistent relative strength, supported by institutional buying pressure and favorable trend alignment, as the gaming industry proves less cyclical than traditional tech—benefiting from digital platform expansion, esports monetization, and the evergreen demand for interactive content across economic cycles.
🌬️ BEAR? BULL? Wind Energy (FAN ETF) – When Relative Strength Diverges from Money Flow Reality
FAN tracks a global basket of turbine makers, developers and utilities. FAN’s current setup highlights a classic "looks better than it feels" scenario—where the Relative Strength Rank Trend (RSR) is quietly improving, signaling price stability and even outperformance versus peers, but beneath the surface, Chaikin Money Flow (CMF) is signaling institutional capitulation. The sharp divergence—rising RS rank against deeply negative money flow—suggests that while price action is stabilizing or bouncing on lighter volume, the smart money has been heading for the exits. Layer in a mixed trend structure—long-term bearish, but intermediate-term bullish—and you get a textbook case of a countertrend rally within a damaged sector.
⚠️ Policy Uncertainty = Institutional Caution
Price action has stabilised enough to move the ETF up the RS rank table (below), but the deeply negative Chaikin Money Flow tells us institutions are still selling into every rally. The split comes down to a cocktail of policy and macro shocks that scare long-horizon investors even as short-term traders bottom-fish:
📝 Cheat Sheets Insight

Price looks better because the sector was bombed-out and is now bouncing against weaker parts of the market, pushing FAN’s RS rank upward. Flows, however, remain ugly because big investors see an unstable policy backdrop—U.S. tax incentives in limbo, projects on hold, and developers cutting spending—to the point that they’re still pulling capital until the rules of the game stop changing. Until Washington clarifies long-term subsidies and permitting, expect this divergence to linger: relative-strength rallies that lack the confirming bid from serious money.
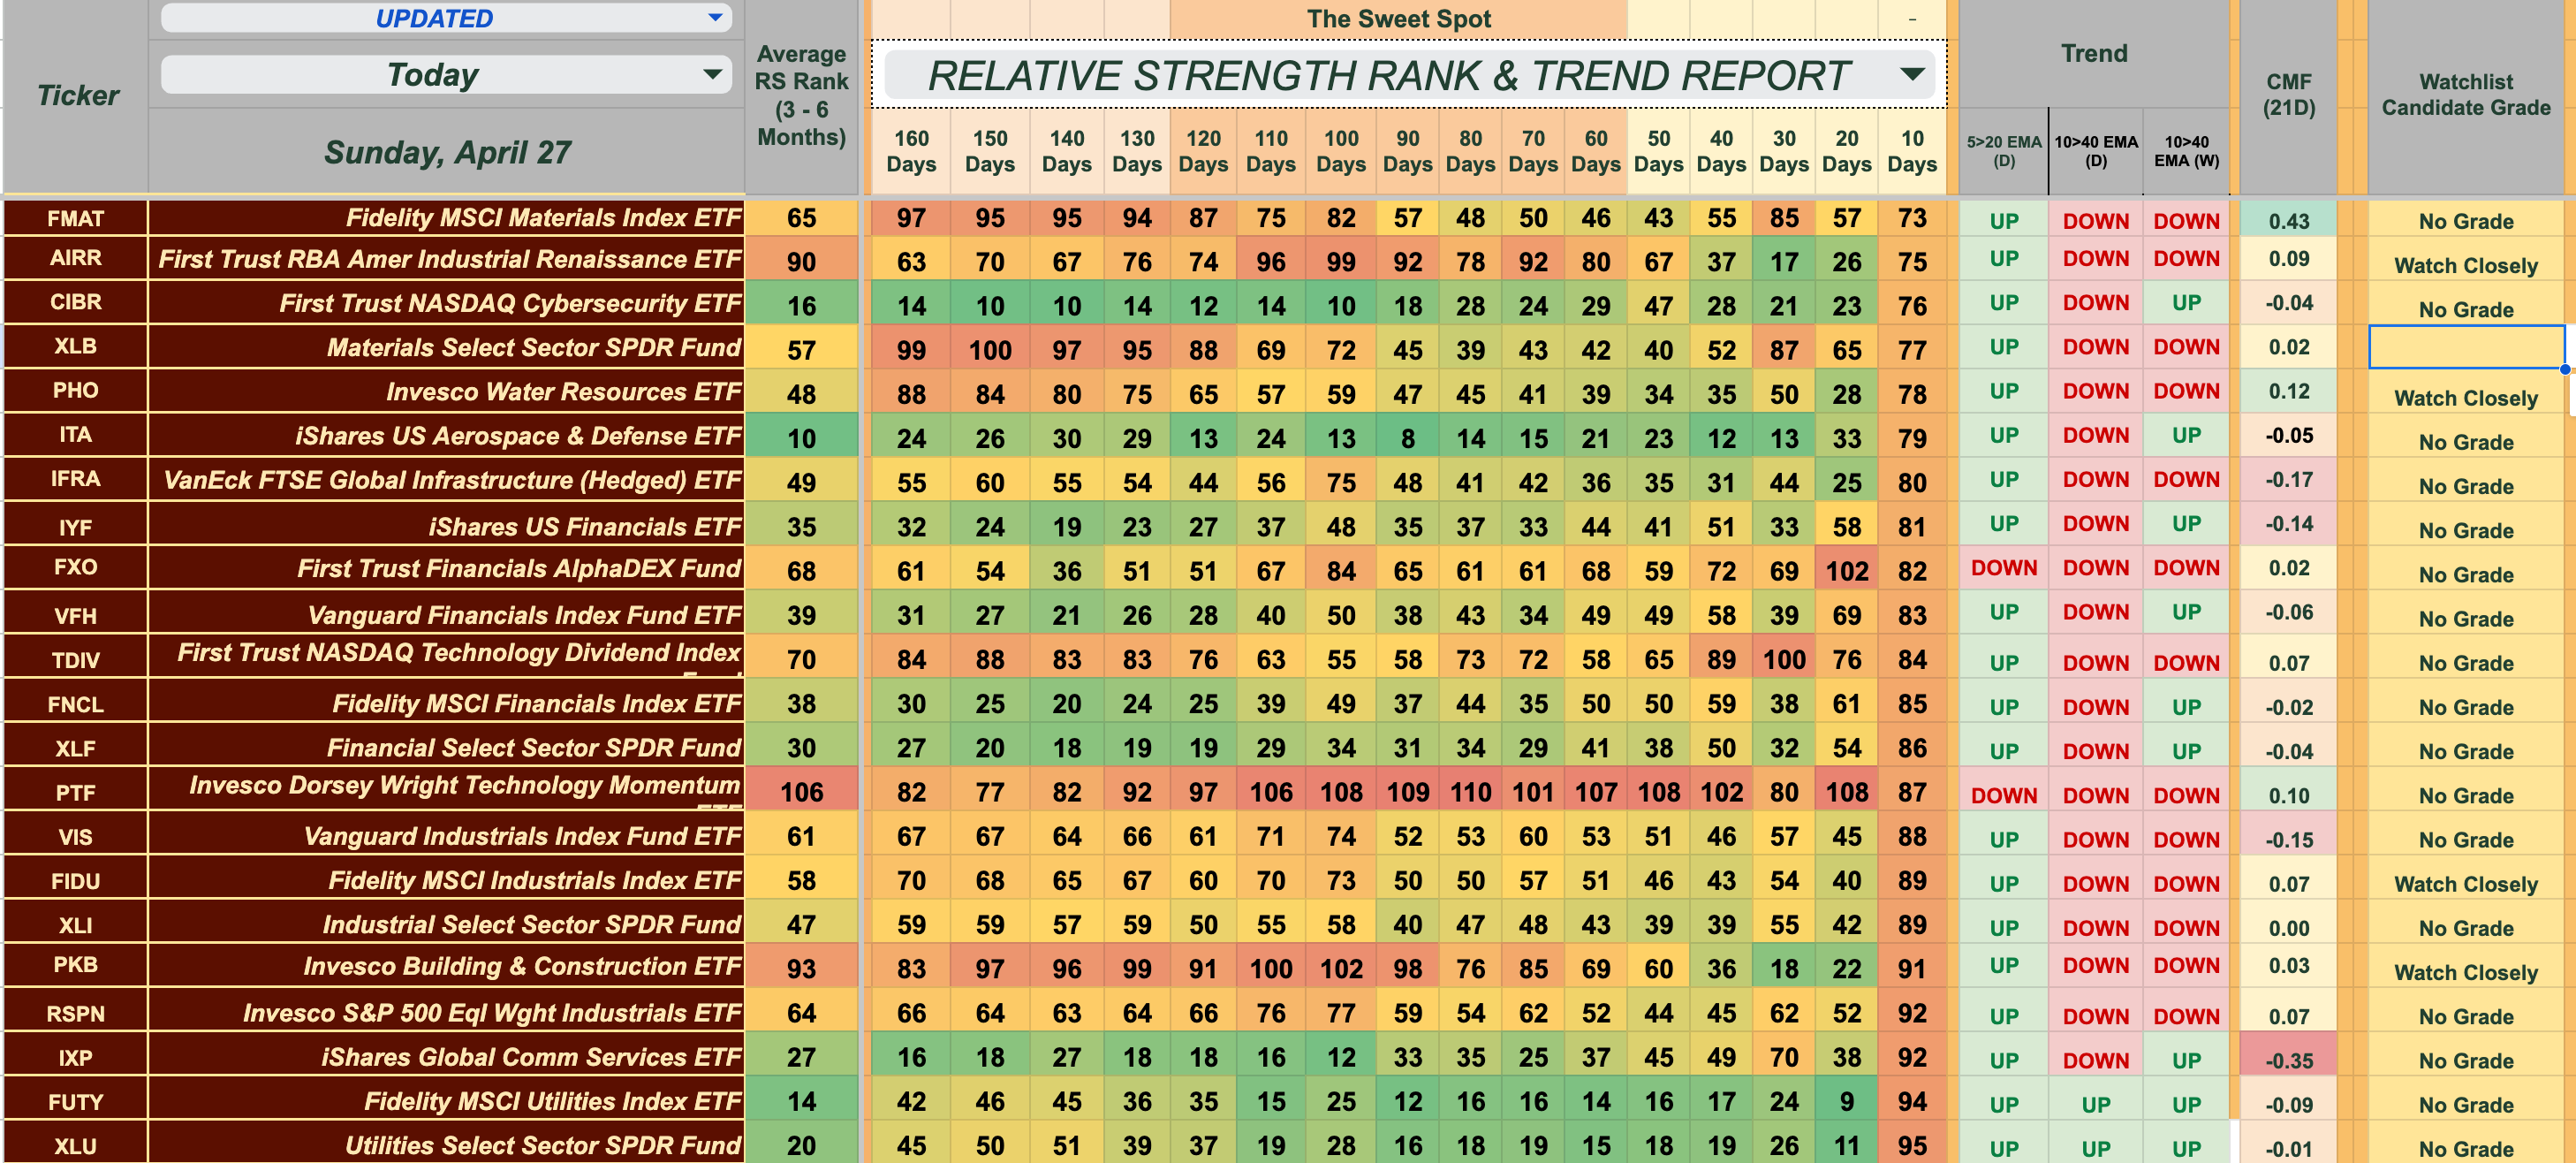
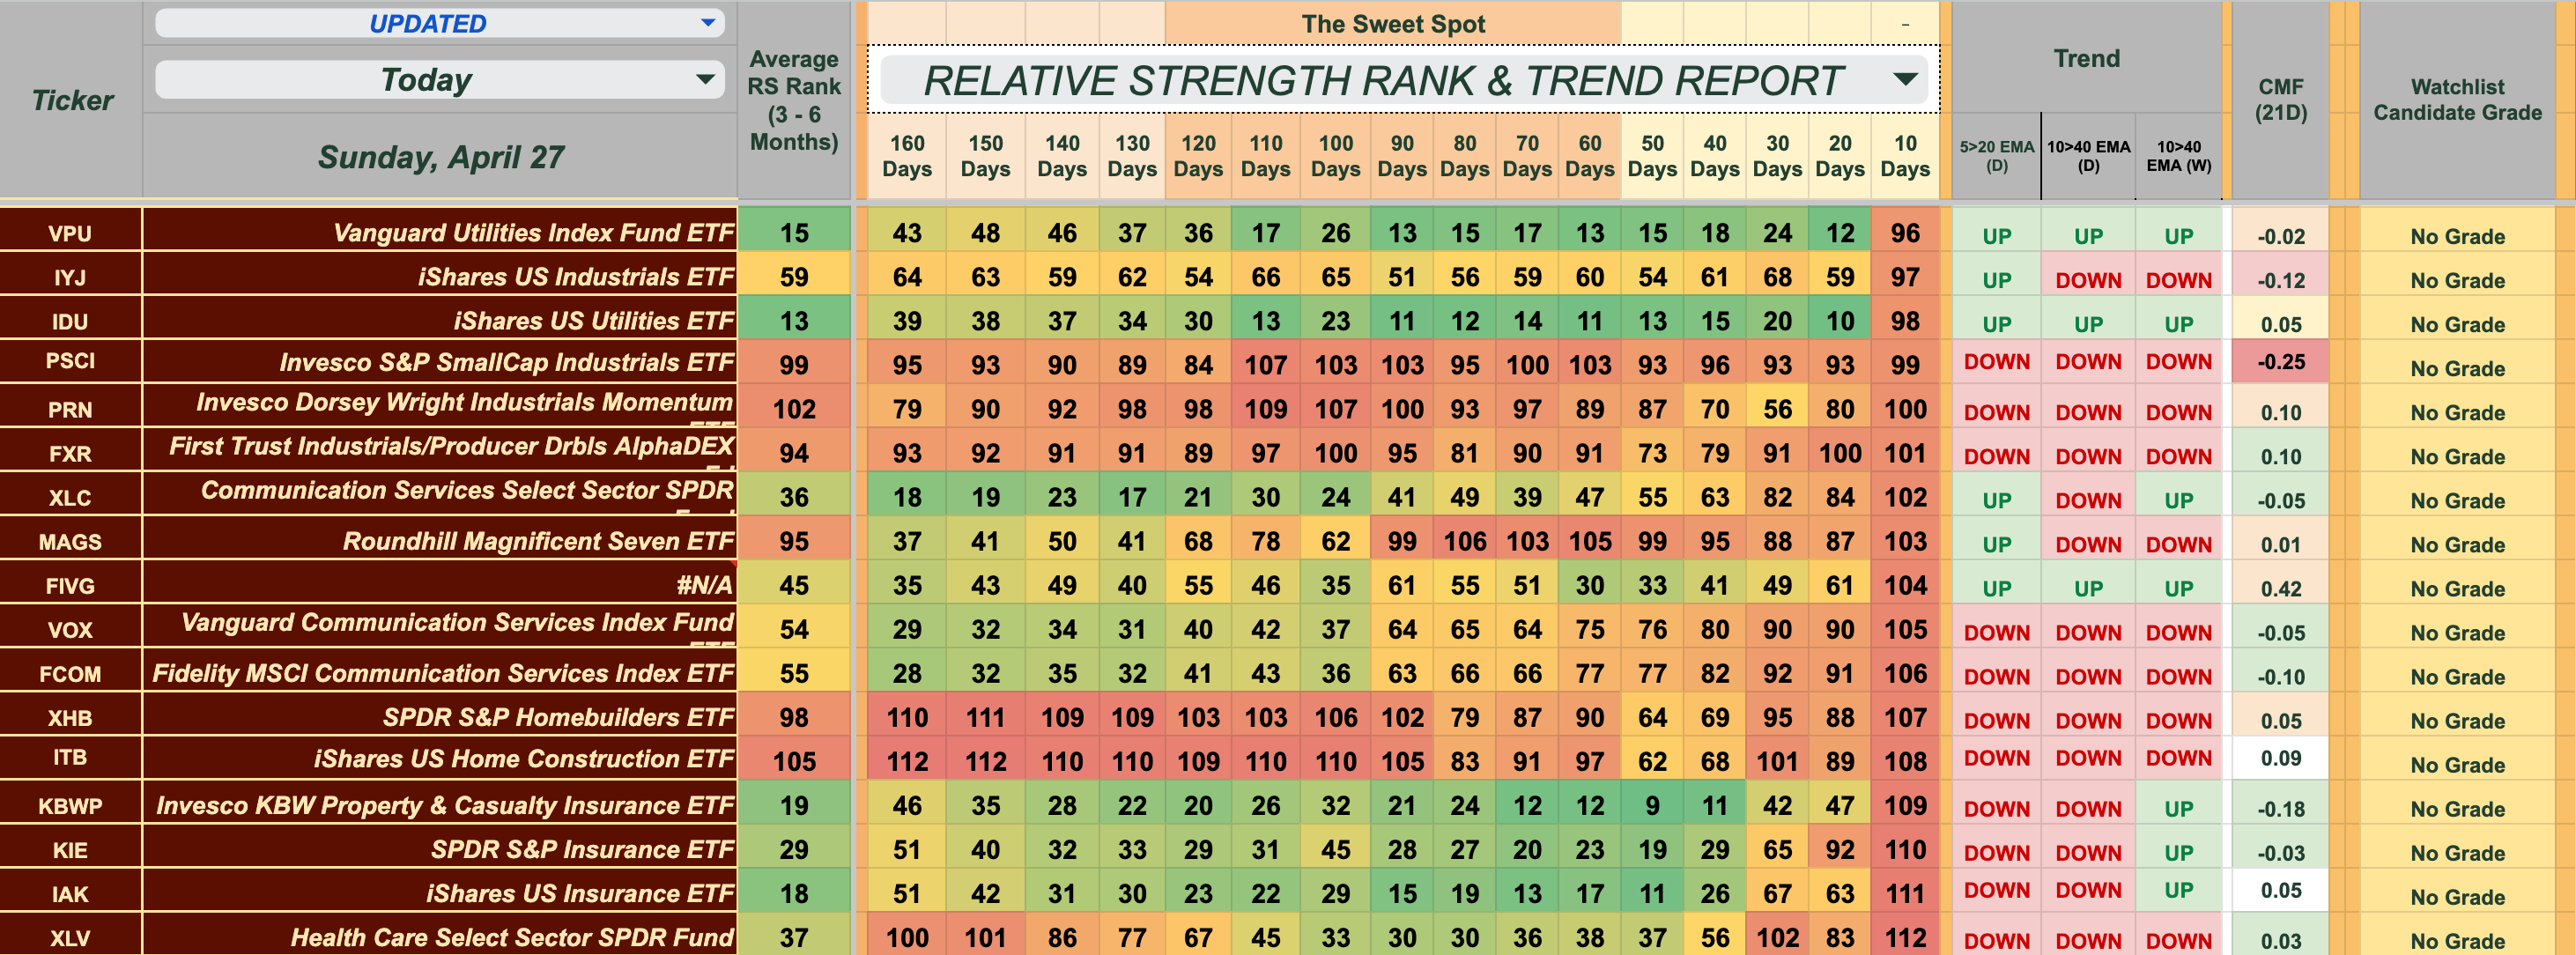
RSR&T: Top 27 Sub-Sector ETFs (Past 10 Trading Days)
Relative Strength Trend, Actual Price Trends in Multiple Time Frames and Buying Pressure As Measured by CMF combine to give us our WatchList grades. Watch the video above find out how to quickly you can find the strength in the market and eliminate most of the noise with this leading-indicator collection. It will help you “skate to where the puck is going to be!”

While gold and silver have traditionally led such moves, recent developments suggest that copper and uranium are gaining traction, though we’re approaching with some caution since we haven’t reached the RS sweet spot. Plus, the lack of significant money flow means an absence of confirmation for the metals ETFs above.
🟠 Copper (COPX): Approaching a Structural Supply Crunch
Copper's long-term outlook is increasingly bullish, driven by anticipated supply deficits and rising demand. Bullish Relative Strength Rotation not confirmed by Chaikin Money Flow:
Supply Constraints: Analysts from Bank of America project that the copper market will return to a deficit from 2025 onwards, following the completion of current project buildouts. The underperformance of new copper mine developments in recent years exacerbates this issue.
Demand Drivers: The global push for electrification, including electric vehicles and renewable energy infrastructure, is expected to significantly increase copper demand.
☢️ Uranium: Navigating Volatility Amid Strong Fundamentals
Early Bullish Relative Strength Rotation, but no CMF confirmation. Meaningful trends are down. Fundamentally speaking, Tthe uranium market is experiencing a complex interplay of supply challenges and growing demand:
Price Volatility: After reaching nearly two-decade highs in 2024, the spot price of uranium (U3O8) declined by 13.26% in Q1 2025, settling around $64.83 per pound by March 31.
Supply Shortfalls: Global uranium mine supply has consistently fallen short of demand, meeting only 74% of global needs in 2022. This persistent deficit is due to years of underinvestment and operational delays.
Geopolitical Factors: The U.S. has enacted the Prohibiting Russian Uranium Imports Act, targeting a significant reliance on Russian enriched uranium, which accounted for 27% of U.S. demand as recently as 2023. This move has prompted a reorganization of supply chains as Western utilities seek alternatives. But like most of world trade at the moments, it’s all in flux.
📈 Internet of Things
We’re flagging “ungraded” SNSR—because this one’s flashing a potential major shift. Though it’s early for traders, money flow at .45 gets our attention. Investors? Here’s the bull case. The Global X Internet of Things ETF (SNSR) is designed to capture growth from the rapidly expanding world of connected devices—think smart homes, autonomous vehicles, industrial automation, and wearable tech. It targets companies enabling the "Internet of Things" (IoT) revolution, where everyday objects are linked via sensors, software, and data networks. As IoT converges with AI, cloud computing, and 5G infrastructure, SNSR stands at the crossroads of several transformative tech trends. This makes it a potential sleeper play when markets rotate into next-gen digital infrastructure themes.
28 - 50
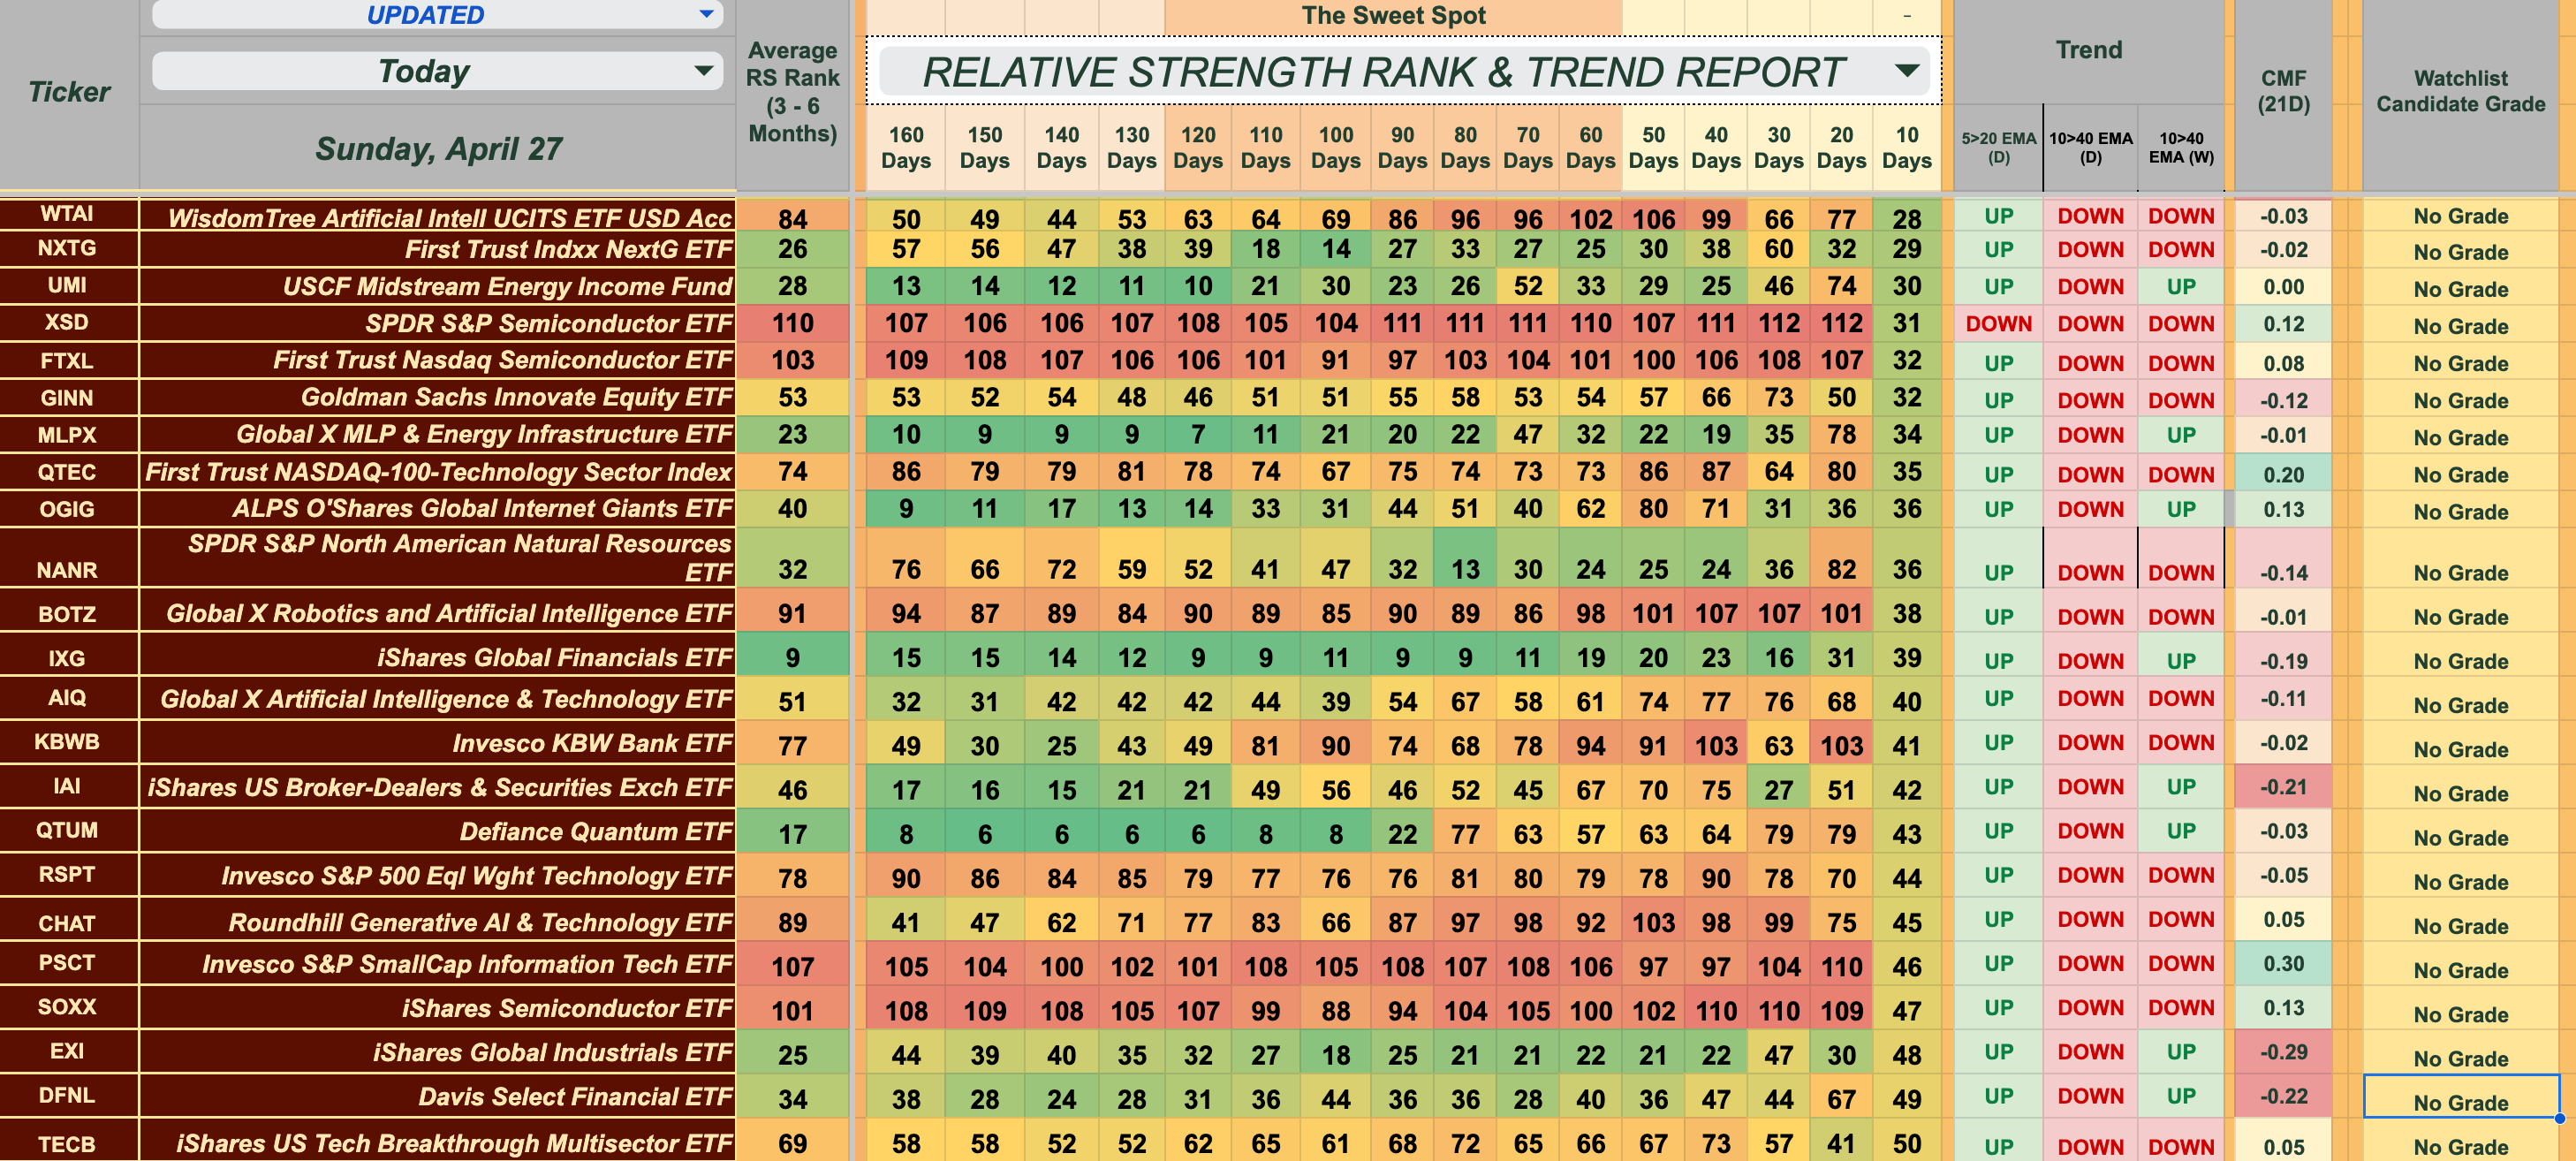
51 - 73 (Accounts for Tie at Rank 53)

74 - 95
96 - 112
Education and risk management are foundational to investing success gained with the support any financial market data or analysis. The StockCheatSheets User Guide offers guidance about how to interpret our data stacks, but it does not offer financial advice or trading/investing education. Use our data service as a starting point for your own research.
ETF and stock market analysis is generally free. Premium stock picks are available to all subscribers via a 7-day complimentary trial. Cheat Sheets Premium membership is only $5/mo, or save better than 15% when taking advantage of our discounted $50 annual subscription price.
Cheat Sheets is a data service to help traders improve decision-making. The author/architect of Cheat Sheet Sheets shares educational concepts related to the skill of trading but will not dispense personal financial guidance. All trades showcased are for demonstration purposes in a simulated investing environment. Disclosure of Trading Risk
Key Links
Get the most out of StockCheatsSheets.com with this quick reference guide.
CBOE Fed Watch Tool - Here
BLS - Employment Data - Here
CPI - Inflation Data - Here
Conference Board - Leading Economic Indicators - Here
Investopedia - Trading Indicators and Education - Here
CNN Fear - Greed Index - Here
The Buffet Over/Under Stock Valuation Indicator - Here
The Shiller S&P 500 PE Ratio - Here
US Debt to GDP - Here
Credit Spreads - Here

Share this post